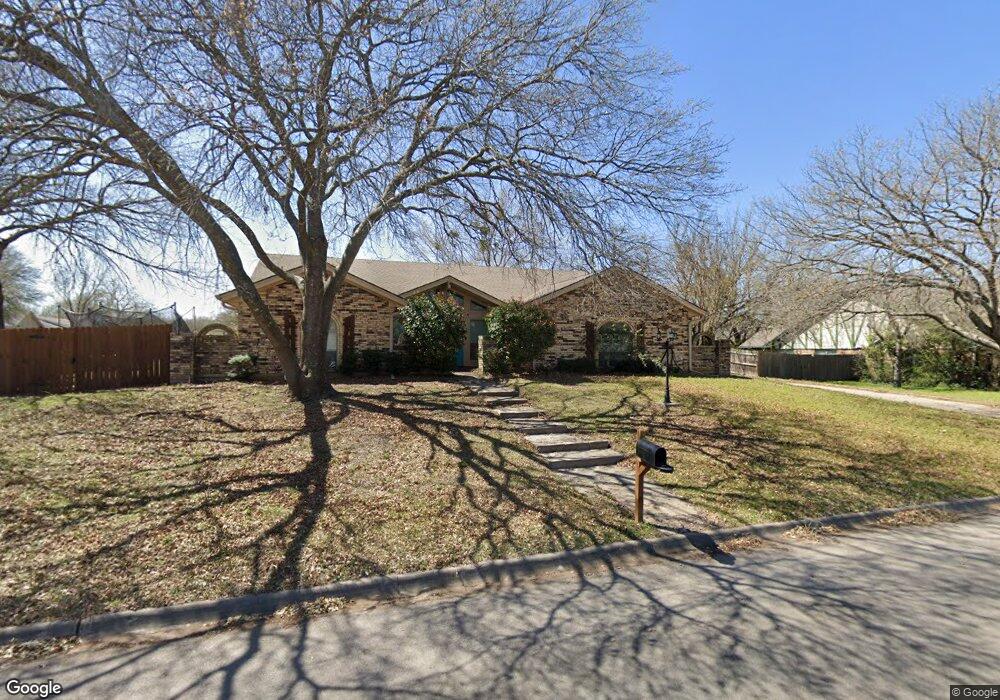
902 Berkley Dr Cleburne, TX 76033
Estimated Value: $318,000 - $342,000
4
Beds
3
Baths
2,032
Sq Ft
$162/Sq Ft
Est. Value
About This Home
This home is located at 902 Berkley Dr, Cleburne, TX 76033 and is currently estimated at $328,944, approximately $161 per square foot. 902 Berkley Dr is a home located in Johnson County with nearby schools including Coleman Elementary School, Lowell Smith Jr. Middle School, and Cleburne High School.
Ownership History
Date
Name
Owned For
Owner Type
Purchase Details
Closed on
Jun 28, 2016
Sold by
Neill Investment Llc
Bought by
Applegate Terry F and Applegate Jacqueline M
Current Estimated Value
Home Financials for this Owner
Home Financials are based on the most recent Mortgage that was taken out on this home.
Original Mortgage
$187,150
Outstanding Balance
$149,402
Interest Rate
3.58%
Mortgage Type
New Conventional
Estimated Equity
$179,542
Purchase Details
Closed on
May 26, 2015
Sold by
The Bank Of New York Mellon Trust Co Na
Bought by
Neill Investments Llc
Purchase Details
Closed on
Jan 6, 2015
Sold by
Rodriguez Joseph and Rodriguez Caroline
Bought by
The Bank Of New York Mellon Trust Co Na
Purchase Details
Closed on
Mar 15, 2013
Sold by
Rodriguez Caroline Trevino
Bought by
Rodriguez Joe A
Create a Home Valuation Report for This Property
The Home Valuation Report is an in-depth analysis detailing your home's value as well as a comparison with similar homes in the area
Home Values in the Area
Average Home Value in this Area
Purchase History
| Date | Buyer | Sale Price | Title Company |
|---|---|---|---|
| Applegate Terry F | -- | None Available | |
| Neill Investments Llc | -- | None Available | |
| The Bank Of New York Mellon Trust Co Na | $106,993 | None Available | |
| Rodriguez Joe A | -- | None Available |
Source: Public Records
Mortgage History
| Date | Status | Borrower | Loan Amount |
|---|---|---|---|
| Open | Applegate Terry F | $187,150 |
Source: Public Records
Tax History
| Year | Tax Paid | Tax Assessment Tax Assessment Total Assessment is a certain percentage of the fair market value that is determined by local assessors to be the total taxable value of land and additions on the property. | Land | Improvement |
|---|---|---|---|---|
| 2025 | $4,617 | $302,259 | $65,000 | $237,259 |
| 2024 | $6,044 | $271,065 | $0 | $0 |
| 2023 | $4,096 | $316,850 | $65,000 | $251,850 |
| 2022 | $5,606 | $273,492 | $55,000 | $218,492 |
| 2021 | $5,314 | $240,178 | $45,000 | $195,178 |
| 2020 | $5,130 | $185,141 | $30,000 | $155,141 |
| 2019 | $5,471 | $185,142 | $30,000 | $155,142 |
| 2018 | $5,473 | $185,142 | $30,000 | $155,142 |
| 2017 | $5,095 | $173,068 | $25,000 | $148,068 |
| 2016 | $4,689 | $159,285 | $25,000 | $134,285 |
Source: Public Records
Map
Nearby Homes
- 1115 Green River Trail
- 4112 Highland Dr
- 1114 Willowcreek Rd
- 909 Highland Dr
- 1003 Canton Rd
- 1108 Trace Rd
- 840 S Ridgeway Dr
- 1211 Greenbriar Ln
- 1204 W Westhill Dr
- 1208 Cindy Ln
- 1104 Cherrywood Dr
- 1225 Crestwood Dr
- 1303 Glenhaven Dr
- 1215 Bradley Dr
- 616 Bellevue Dr
- 832 Featherston St
- 505 Bellevue Dr
- 806 S Colonial Dr
- 1327 Hemphill Dr
- 1107 Stanwood Ave
- 1102 Green River Trail
- 900 Berkley Dr
- 1000 Berkley Dr
- 1103 Willowcreek Rd
- 1104 Green River Trail
- 1103 Green River Trail
- 903 Berkley Dr
- 905 Berkley Dr
- 1105 Willowcreek Rd
- 1105 Green River Trail
- 901 Berkley Dr
- 1001 Berkley Dr
- 1106 Green River Trail
- 1002 Berkley Dr
- 1107 Willowcreek Rd
- 1107 Green River Trail
- 810 Berkley Dr
- 1102 Berkley Ct
- 1102 Willowcreek Rd
- 1011 Willowcreek Rd