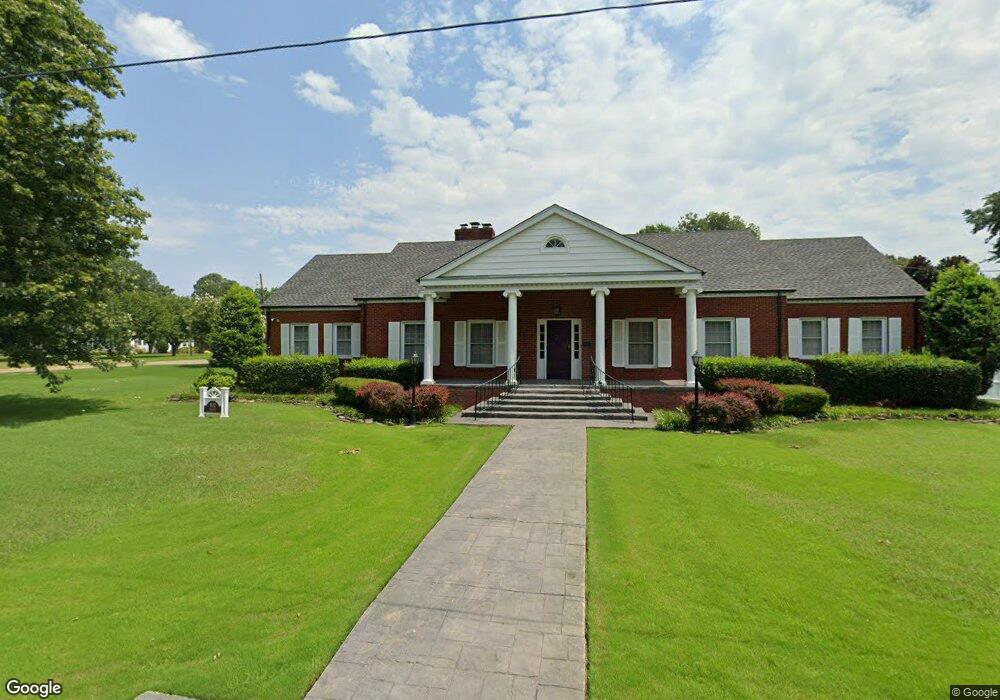
902 Chestnut St Jonesboro, AR 72401
Estimated Value: $433,000 - $494,000
4
Beds
5
Baths
4,077
Sq Ft
$115/Sq Ft
Est. Value
About This Home
This home is located at 902 Chestnut St, Jonesboro, AR 72401 and is currently estimated at $468,406, approximately $114 per square foot. 902 Chestnut St is a home located in Craighead County with nearby schools including Annie Camp Junior High School, The Academies at Jonesboro High School, and Montessori School of Jonesboro.
Ownership History
Date
Name
Owned For
Owner Type
Purchase Details
Closed on
Oct 21, 2011
Sold by
Kochel Charles and Kochel Brooke
Bought by
Grojean Kelly
Current Estimated Value
Home Financials for this Owner
Home Financials are based on the most recent Mortgage that was taken out on this home.
Original Mortgage
$216,000
Outstanding Balance
$19,509
Interest Rate
3.37%
Mortgage Type
New Conventional
Estimated Equity
$448,897
Purchase Details
Closed on
Nov 30, 2007
Sold by
Lacy Patricia Lynn Tilton and Roleson Mike
Bought by
Kochel Charles G and Kochel Autumn L
Home Financials for this Owner
Home Financials are based on the most recent Mortgage that was taken out on this home.
Original Mortgage
$39,100
Interest Rate
6.27%
Mortgage Type
Credit Line Revolving
Purchase Details
Closed on
Dec 1, 1989
Bought by
Lynn Tilton
Create a Home Valuation Report for This Property
The Home Valuation Report is an in-depth analysis detailing your home's value as well as a comparison with similar homes in the area
Home Values in the Area
Average Home Value in this Area
Purchase History
| Date | Buyer | Sale Price | Title Company |
|---|---|---|---|
| Grojean Kelly | $270,000 | None Available | |
| Kochel Charles G | $250,000 | None Available | |
| Lynn Tilton | -- | -- |
Source: Public Records
Mortgage History
| Date | Status | Borrower | Loan Amount |
|---|---|---|---|
| Open | Grojean Kelly | $216,000 | |
| Previous Owner | Kochel Charles G | $39,100 | |
| Previous Owner | Kochel Charles G | $196,400 |
Source: Public Records
Tax History Compared to Growth
Tax History
| Year | Tax Paid | Tax Assessment Tax Assessment Total Assessment is a certain percentage of the fair market value that is determined by local assessors to be the total taxable value of land and additions on the property. | Land | Improvement |
|---|---|---|---|---|
| 2025 | $3,422 | $82,729 | $7,000 | $75,729 |
| 2024 | $3,422 | $82,729 | $7,000 | $75,729 |
| 2023 | $3,018 | $81,758 | $7,000 | $74,758 |
| 2022 | $2,767 | $81,758 | $7,000 | $74,758 |
| 2021 | $2,576 | $61,050 | $7,000 | $54,050 |
| 2020 | $2,576 | $61,050 | $7,000 | $54,050 |
| 2019 | $2,576 | $61,050 | $7,000 | $54,050 |
| 2018 | $2,576 | $61,050 | $7,000 | $54,050 |
| 2017 | $2,576 | $61,050 | $7,000 | $54,050 |
| 2016 | $2,513 | $59,560 | $7,000 | $52,560 |
| 2015 | $2,513 | $59,560 | $7,000 | $52,560 |
| 2014 | $2,513 | $59,560 | $7,000 | $52,560 |
Source: Public Records
Map
Nearby Homes
- 1323 W Jefferson Ave
- 903 W Matthews Ave
- 904 W Oak Ave
- 1136 Walnut St
- 1130 Vine St
- 902 Hester St
- 735 W Oak Ave
- 919 W Washington Ave
- 730 W Cherry Ave
- 901 Hester St
- 2714 W Matthews Ave
- 1217 Olive St
- 801 S Culberhouse St
- 1001 W Huntington Ave
- 644 W Matthews Ave
- 636 Warner Ave
- 637 W Oak Ave
- 812 W Nettleton Ave
- 1607 W Washington Ave
- 604 Meadowbrook St
- 903 Chestnut St
- 1124 Warner Ave
- 1107 Warner Ave
- 1120 Warner Ave
- 1203 Warner Ave
- 1120 W Oak Ave
- 1114 Warner Ave
- 1114 W Warner
- W Warner Ave
- 909 Chestnut St
- 807 Chestnut St
- 1103 Warner Ave
- 1110 W Oak Ave
- 1112 Warner Ave
- 1205 Warner Ave
- 1200 W Oak Ave
- 804 Chestnut St
- 909 Nisbett St
- 1106 W Oak Ave
- 1106 Warner Ave