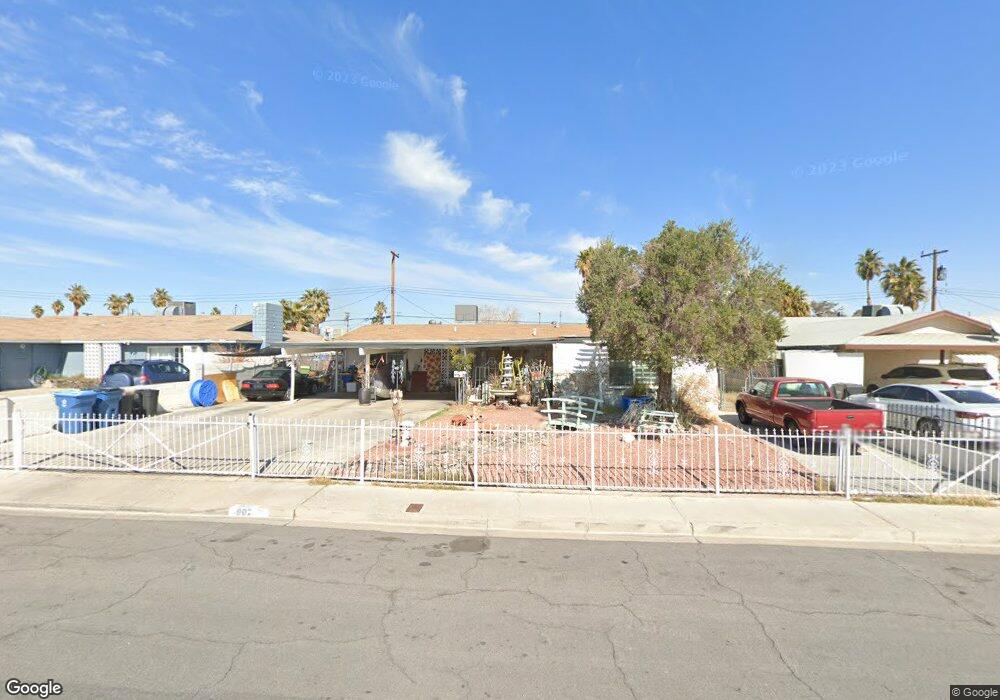
902 Dalton Dr Las Vegas, NV 89119
University District NeighborhoodEstimated Value: $352,186 - $410,000
3
Beds
2
Baths
1,620
Sq Ft
$234/Sq Ft
Est. Value
About This Home
This home is located at 902 Dalton Dr, Las Vegas, NV 89119 and is currently estimated at $378,797, approximately $233 per square foot. 902 Dalton Dr is a home located in Clark County with nearby schools including Gene Ward Elementary School, Jack Dailey Elementary School, and Helen C. Cannon Junior High School.
Ownership History
Date
Name
Owned For
Owner Type
Purchase Details
Closed on
Feb 29, 2024
Sold by
Castro Jose E
Bought by
Castro Family Trust and Castro
Current Estimated Value
Purchase Details
Closed on
Nov 18, 2005
Sold by
Castro Menchie B
Bought by
Castro Jose E
Home Financials for this Owner
Home Financials are based on the most recent Mortgage that was taken out on this home.
Original Mortgage
$207,000
Interest Rate
2.5%
Mortgage Type
Negative Amortization
Purchase Details
Closed on
Mar 2, 2004
Sold by
Castro Menchie
Bought by
Castro Jose E
Home Financials for this Owner
Home Financials are based on the most recent Mortgage that was taken out on this home.
Original Mortgage
$137,837
Interest Rate
5.61%
Mortgage Type
FHA
Purchase Details
Closed on
Nov 1, 2001
Sold by
Estrada Salvador and Estrada Yolanda
Bought by
Estrada Salvador and Estrada Yolanda
Create a Home Valuation Report for This Property
The Home Valuation Report is an in-depth analysis detailing your home's value as well as a comparison with similar homes in the area
Home Values in the Area
Average Home Value in this Area
Purchase History
| Date | Buyer | Sale Price | Title Company |
|---|---|---|---|
| Castro Family Trust | -- | None Listed On Document | |
| Castro Jose E | -- | Old Republic Title Co Of Nv | |
| Castro Jose E | -- | Fidelity National Title | |
| Castro Jose E | $140,000 | Fidelity National Title | |
| Estrada Salvador | -- | -- |
Source: Public Records
Mortgage History
| Date | Status | Borrower | Loan Amount |
|---|---|---|---|
| Previous Owner | Castro Jose E | $207,000 | |
| Previous Owner | Castro Jose E | $137,837 |
Source: Public Records
Tax History Compared to Growth
Tax History
| Year | Tax Paid | Tax Assessment Tax Assessment Total Assessment is a certain percentage of the fair market value that is determined by local assessors to be the total taxable value of land and additions on the property. | Land | Improvement |
|---|---|---|---|---|
| 2025 | $952 | $58,383 | $31,500 | $26,883 |
| 2024 | $882 | $58,383 | $31,500 | $26,883 |
| 2023 | $882 | $55,629 | $31,500 | $24,129 |
| 2022 | $817 | $45,500 | $23,800 | $21,700 |
| 2021 | $757 | $43,981 | $23,800 | $20,181 |
| 2020 | $700 | $43,428 | $23,800 | $19,628 |
| 2019 | $656 | $38,133 | $19,250 | $18,883 |
| 2018 | $626 | $35,636 | $17,850 | $17,786 |
| 2017 | $1,042 | $35,513 | $17,850 | $17,663 |
| 2016 | $587 | $30,359 | $13,300 | $17,059 |
| 2015 | $585 | $25,650 | $9,100 | $16,550 |
| 2014 | $568 | $23,196 | $7,000 | $16,196 |
Source: Public Records
Map
Nearby Homes
- 944 de Met Dr
- 5128 Wilbur St
- 861 E Hacienda Ave
- 5155 Gray Ln
- 5125 Gray Ln Unit B
- 922 Westminster Ave
- 942 Westminster Ave
- 5116 Gray Ln Unit G
- 5116 Gray Ln Unit F
- 5116 Gray Ln Unit H
- 5116 Gray Ln Unit E
- 5326 Swenson St Unit 61
- 5117 Greene Ln Unit D
- 5107 Greene Ln Unit M/A
- 5107 Greene Ln Unit L/B
- 5404 Swenson St Unit 34
- 5390 Swenson St Unit 27
- 5384 Swenson St Unit 24
- 1037 Westminster Ave
- 5205 Golden Ln
- 912 Dalton Dr
- 892 Dalton Dr
- 903 Laramore Dr
- 913 Laramore Dr
- 922 Dalton Dr
- 922 Dalton Dr Unit n/a
- 882 Dalton Dr
- 905 Dalton Dr
- 923 Laramore Dr
- 895 Dalton Dr
- 883 Laramore Dr
- 915 Dalton Dr
- 885 Dalton Dr
- 932 Dalton Dr
- 872 Dalton Dr
- 933 Laramore Dr
- 925 Dalton Dr
- 871 Laramore Dr
- 875 Dalton Dr
- 898 Laramore Dr