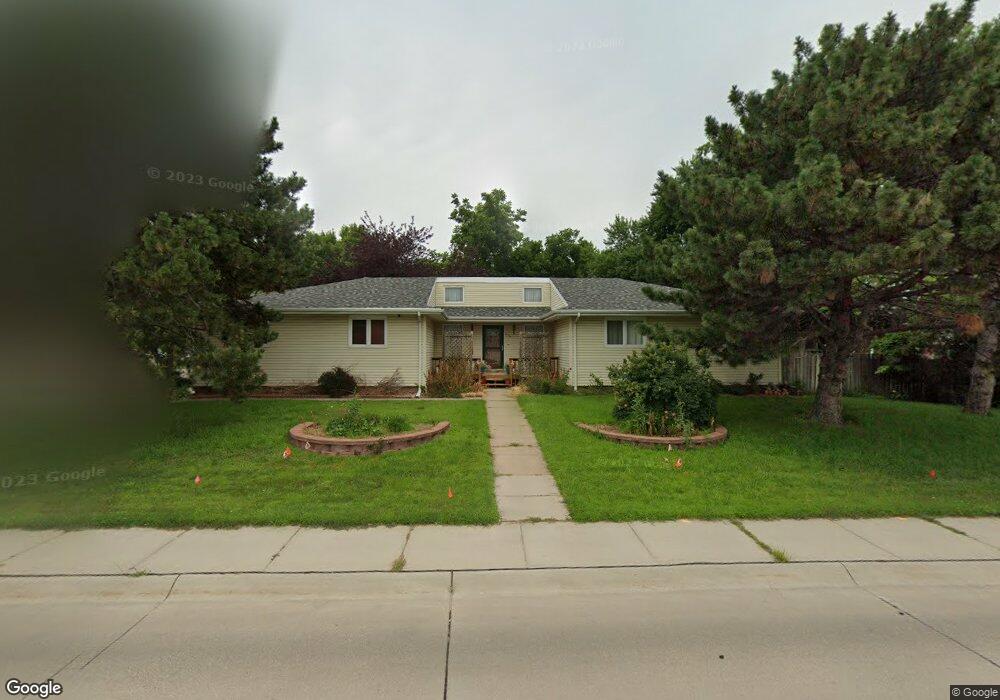
902 E 39th St Kearney, NE 68847
Estimated Value: $269,000 - $323,000
Studio
1
Bath
1,398
Sq Ft
$217/Sq Ft
Est. Value
About This Home
This home is located at 902 E 39th St, Kearney, NE 68847 and is currently estimated at $303,330, approximately $216 per square foot. 902 E 39th St is a home located in Buffalo County with nearby schools including Northeast Elementary School, Sunrise Middle School, and Kearney Senior High School.
Ownership History
Date
Name
Owned For
Owner Type
Purchase Details
Closed on
Feb 14, 2020
Sold by
Tubbs Jack C and Tubbs Donna M
Bought by
Reisen Zachary Lee and Reisen Emilie Jean
Current Estimated Value
Home Financials for this Owner
Home Financials are based on the most recent Mortgage that was taken out on this home.
Original Mortgage
$185,250
Outstanding Balance
$164,026
Interest Rate
3.6%
Mortgage Type
New Conventional
Estimated Equity
$139,304
Purchase Details
Closed on
Aug 23, 2006
Sold by
Stoeger Wilke Colin M and Stoeger Wilke Janet
Bought by
Tubbs Jack C and Tubbs Donna M
Create a Home Valuation Report for This Property
The Home Valuation Report is an in-depth analysis detailing your home's value as well as a comparison with similar homes in the area
Home Values in the Area
Average Home Value in this Area
Purchase History
| Date | Buyer | Sale Price | Title Company |
|---|---|---|---|
| Reisen Zachary Lee | $195,000 | None Available | |
| Tubbs Jack C | $140,000 | -- |
Source: Public Records
Mortgage History
| Date | Status | Borrower | Loan Amount |
|---|---|---|---|
| Open | Reisen Zachary Lee | $185,250 |
Source: Public Records
Tax History
| Year | Tax Paid | Tax Assessment Tax Assessment Total Assessment is a certain percentage of the fair market value that is determined by local assessors to be the total taxable value of land and additions on the property. | Land | Improvement |
|---|---|---|---|---|
| 2025 | $3,624 | $282,060 | $55,590 | $226,470 |
| 2024 | $4,118 | $270,990 | $53,965 | $217,025 |
| 2023 | $4,118 | $241,975 | $53,965 | $188,010 |
| 2022 | $4,420 | $251,875 | $50,800 | $201,075 |
| 2021 | $4,025 | $233,370 | $46,915 | $186,455 |
| 2020 | $3,948 | $228,250 | $44,140 | $184,110 |
| 2019 | $3,974 | $226,985 | $43,965 | $183,020 |
| 2018 | $3,660 | $212,070 | $35,925 | $176,145 |
| 2017 | $3,655 | $213,155 | $35,925 | $177,230 |
| 2016 | $3,625 | $213,155 | $35,925 | $177,230 |
| 2015 | $3,276 | $188,330 | $0 | $0 |
| 2014 | $3,050 | $159,965 | $0 | $0 |
Source: Public Records
Map
Nearby Homes
Your Personal Tour Guide
Ask me questions while you tour the home.