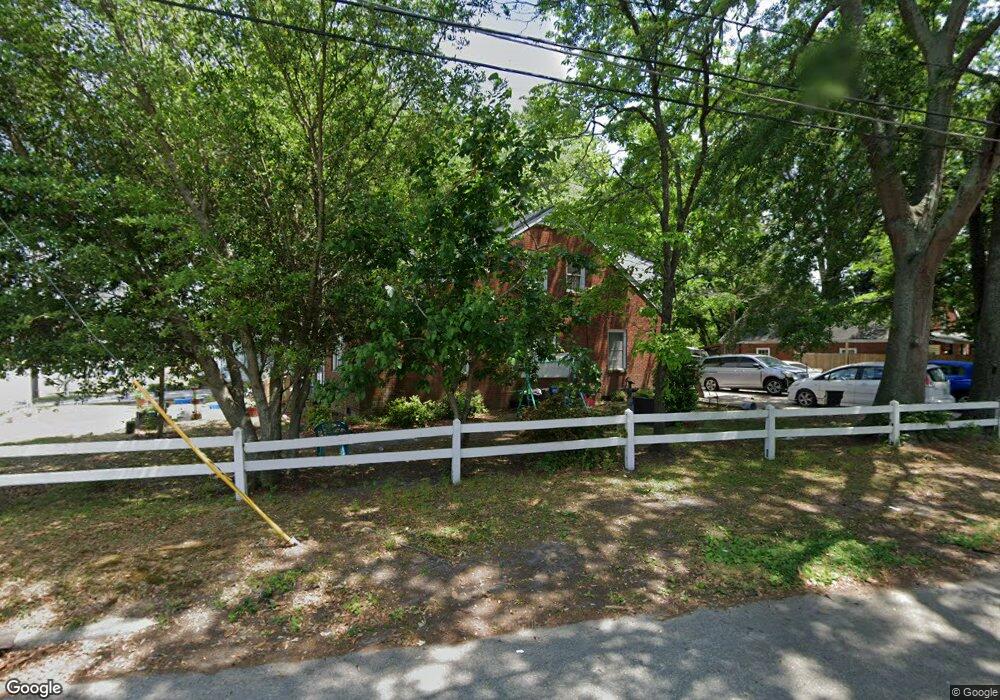
902 E 7th St Lumberton, NC 28358
Estimated Value: $123,000 - $205,634
3
Beds
2
Baths
2,214
Sq Ft
$83/Sq Ft
Est. Value
About This Home
This home is located at 902 E 7th St, Lumberton, NC 28358 and is currently estimated at $182,659, approximately $82 per square foot. 902 E 7th St is a home located in Robeson County with nearby schools including Rowland Norment Elementary School, Parkton Elementary School, and L. Gilbert Carroll Middle School.
Ownership History
Date
Name
Owned For
Owner Type
Purchase Details
Closed on
Feb 29, 2012
Sold by
Bowen Woodberry L and Bowen Joan S
Bought by
Riversky Llc
Current Estimated Value
Home Financials for this Owner
Home Financials are based on the most recent Mortgage that was taken out on this home.
Original Mortgage
$270,000
Outstanding Balance
$185,648
Interest Rate
3.89%
Mortgage Type
Future Advance Clause Open End Mortgage
Estimated Equity
-$2,989
Purchase Details
Closed on
May 9, 2011
Sold by
Hughes William M and Canady Paul T
Bought by
Bowen Woodberry
Create a Home Valuation Report for This Property
The Home Valuation Report is an in-depth analysis detailing your home's value as well as a comparison with similar homes in the area
Purchase History
| Date | Buyer | Sale Price | Title Company |
|---|---|---|---|
| Riversky Llc | -- | None Available | |
| Bowen Woodberry | $37,000 | -- |
Source: Public Records
Mortgage History
| Date | Status | Borrower | Loan Amount |
|---|---|---|---|
| Open | Riversky Llc | $270,000 |
Source: Public Records
Tax History
| Year | Tax Paid | Tax Assessment Tax Assessment Total Assessment is a certain percentage of the fair market value that is determined by local assessors to be the total taxable value of land and additions on the property. | Land | Improvement |
|---|---|---|---|---|
| 2025 | $1,423 | $179,100 | $15,400 | $163,700 |
| 2024 | $1,418 | $179,100 | $15,400 | $163,700 |
| 2023 | $1,045 | $128,800 | $14,000 | $114,800 |
| 2022 | $1,027 | $126,400 | $14,000 | $112,400 |
| 2021 | $1,027 | $126,400 | $14,000 | $112,400 |
| 2020 | $1,013 | $126,400 | $14,000 | $112,400 |
| 2018 | $1,033 | $113,100 | $10,000 | $103,100 |
| 2017 | $931 | $113,100 | $10,000 | $103,100 |
| 2016 | $931 | $113,100 | $10,000 | $103,100 |
| 2015 | $931 | $113,100 | $10,000 | $103,100 |
| 2014 | $931 | $113,100 | $10,000 | $103,100 |
Source: Public Records
Map
Nearby Homes
Your Personal Tour Guide
Ask me questions while you tour the home.