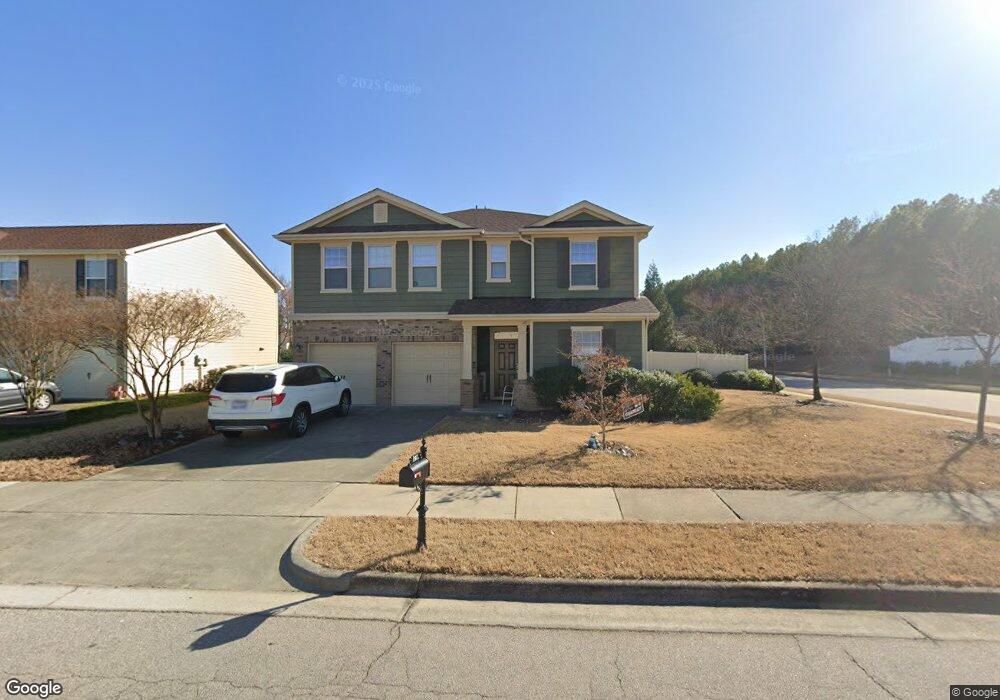
902 Iverton Ln Cary, NC 27519
Twin Lakes NeighborhoodEstimated Value: $581,000 - $622,000
4
Beds
3
Baths
2,342
Sq Ft
$258/Sq Ft
Est. Value
About This Home
This home is located at 902 Iverton Ln, Cary, NC 27519 and is currently estimated at $604,738, approximately $258 per square foot. 902 Iverton Ln is a home located in Wake County with nearby schools including Cedar Fork Elementary, West Cary Middle School, and Panther Creek High School.
Ownership History
Date
Name
Owned For
Owner Type
Purchase Details
Closed on
Sep 28, 2015
Sold by
Cirino John J and Cirino Deanna R
Bought by
Nigam Anshu and Nigam Shefalika
Current Estimated Value
Home Financials for this Owner
Home Financials are based on the most recent Mortgage that was taken out on this home.
Original Mortgage
$247,920
Outstanding Balance
$188,120
Interest Rate
2.87%
Mortgage Type
Adjustable Rate Mortgage/ARM
Estimated Equity
$416,618
Purchase Details
Closed on
Feb 7, 2012
Sold by
Cirino John J and Dye Deanna R
Bought by
Cirino John J and Cirino Deanna R
Home Financials for this Owner
Home Financials are based on the most recent Mortgage that was taken out on this home.
Original Mortgage
$285,219
Interest Rate
3.25%
Mortgage Type
VA
Purchase Details
Closed on
Jun 23, 2010
Sold by
Kb Home Raleigh Durham Inc
Bought by
Cirino John J and Dye Deanna R
Home Financials for this Owner
Home Financials are based on the most recent Mortgage that was taken out on this home.
Original Mortgage
$283,665
Interest Rate
4.91%
Mortgage Type
VA
Create a Home Valuation Report for This Property
The Home Valuation Report is an in-depth analysis detailing your home's value as well as a comparison with similar homes in the area
Home Values in the Area
Average Home Value in this Area
Purchase History
| Date | Buyer | Sale Price | Title Company |
|---|---|---|---|
| Nigam Anshu | $310,000 | Attorney | |
| Cirino John J | -- | Liberty Title Company Llc | |
| Cirino John J | $275,000 | None Available |
Source: Public Records
Mortgage History
| Date | Status | Borrower | Loan Amount |
|---|---|---|---|
| Open | Nigam Anshu | $247,920 | |
| Previous Owner | Cirino John J | $285,219 | |
| Previous Owner | Cirino John J | $283,665 |
Source: Public Records
Tax History
| Year | Tax Paid | Tax Assessment Tax Assessment Total Assessment is a certain percentage of the fair market value that is determined by local assessors to be the total taxable value of land and additions on the property. | Land | Improvement |
|---|---|---|---|---|
| 2025 | $4,972 | $577,806 | $180,000 | $397,806 |
| 2024 | $4,865 | $577,806 | $180,000 | $397,806 |
Source: Public Records
Map
Nearby Homes
- 605 Beech Hanger Dr
- 106 Honeycomb Ln
- 1329 Alemany St
- 226 Leacroft Way
- 105 Bayless Ridge Ct
- 309 Malvern Hill Ln
- 316 Valley Glen Dr
- 417 Downing Glen Dr
- 548 Abbey Fields Loop
- 313 Indian Branch Dr
- 1219 Foxglove Dr
- 108 Trumbell Cir
- 3147 Rapid Falls Rd
- 1212 Checkerberry Dr Unit 34
- 11201 Jeremiah St
- 1116 Checkerberry Dr
- 104 Ivy Tree Place
- 318 Madison Grove Place
- 406 Clementine Dr
- 112 Kudrow Ln
- 904 Iverton Ln
- 7003 Lake Grove Blvd
- 101 Deer Isle Ct
- 103 Deer Isle Ct
- 906 Iverton Ln
- 908 Iverton Ln
- 7005 Lake Grove Blvd
- 812 Tranquil Sound Dr
- 907 Iverton Ln
- 306 Seymour Place
- 811 Tranquil Sound Dr
- 7007 Lake Grove Blvd
- 105 Deer Isle Ct
- 308 Seymour Place
- 910 Iverton Ln
- 810 Tranquil Sound Dr
- 909 Iverton Ln
- 809 Tranquil Sound Dr
- 7009 Lake Grove Blvd
- 107 Deer Isle Ct
Your Personal Tour Guide
Ask me questions while you tour the home.