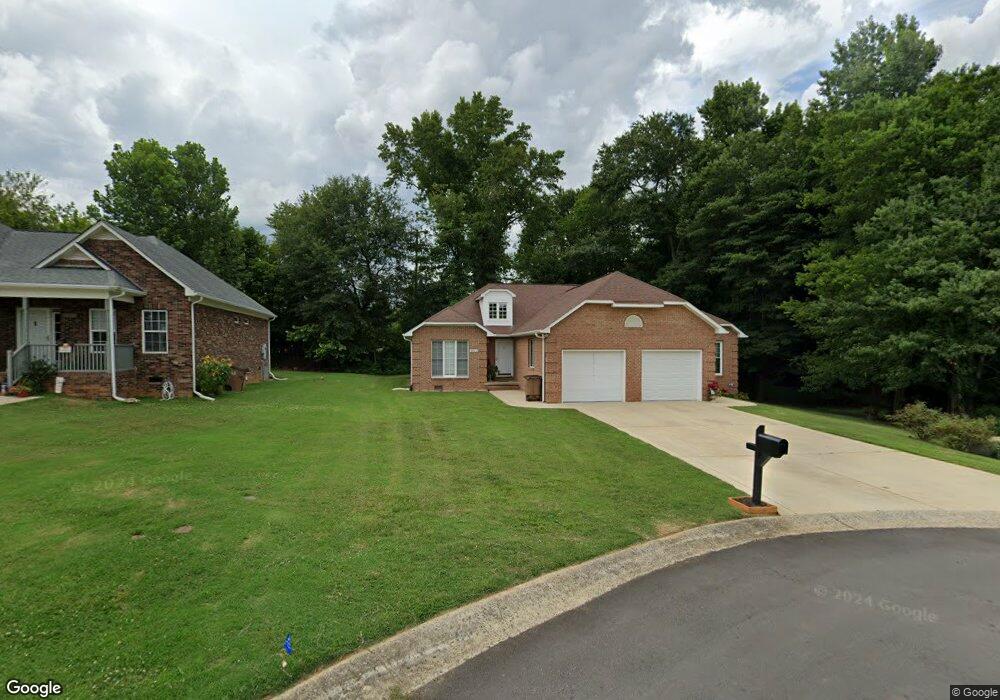
902 Linney Ln Unit B Shelby, NC 28152
Estimated Value: $181,000 - $266,000
2
Beds
2
Baths
1,356
Sq Ft
$164/Sq Ft
Est. Value
About This Home
This home is located at 902 Linney Ln Unit B, Shelby, NC 28152 and is currently estimated at $222,006, approximately $163 per square foot. 902 Linney Ln Unit B is a home located in Cleveland County with nearby schools including Graham Elementary School, James Love Elementary School, and Shelby Middle School.
Ownership History
Date
Name
Owned For
Owner Type
Purchase Details
Closed on
Apr 4, 2022
Sold by
Mary Lavoie
Bought by
Proctor Joshua
Current Estimated Value
Home Financials for this Owner
Home Financials are based on the most recent Mortgage that was taken out on this home.
Original Mortgage
$171,000
Outstanding Balance
$161,316
Interest Rate
4.67%
Mortgage Type
New Conventional
Estimated Equity
$60,690
Purchase Details
Closed on
Jul 10, 2019
Sold by
Prassas Jimmy G
Bought by
Lavoie Mary
Home Financials for this Owner
Home Financials are based on the most recent Mortgage that was taken out on this home.
Original Mortgage
$122,735
Interest Rate
3.9%
Mortgage Type
FHA
Purchase Details
Closed on
Aug 10, 2006
Sold by
Reid Stephene Michelle
Bought by
Prassas Jimmy G
Home Financials for this Owner
Home Financials are based on the most recent Mortgage that was taken out on this home.
Original Mortgage
$105,500
Interest Rate
6.73%
Mortgage Type
New Conventional
Create a Home Valuation Report for This Property
The Home Valuation Report is an in-depth analysis detailing your home's value as well as a comparison with similar homes in the area
Home Values in the Area
Average Home Value in this Area
Purchase History
| Date | Buyer | Sale Price | Title Company |
|---|---|---|---|
| Proctor Joshua | $180,000 | Taylor Law Pllc | |
| Lavoie Mary | $125,000 | Chicago Title | |
| Prassas Jimmy G | $105,500 | None Available |
Source: Public Records
Mortgage History
| Date | Status | Borrower | Loan Amount |
|---|---|---|---|
| Open | Proctor Joshua | $171,000 | |
| Previous Owner | Lavoie Mary | $122,735 | |
| Previous Owner | Prassas Jimmy G | $105,500 |
Source: Public Records
Tax History Compared to Growth
Tax History
| Year | Tax Paid | Tax Assessment Tax Assessment Total Assessment is a certain percentage of the fair market value that is determined by local assessors to be the total taxable value of land and additions on the property. | Land | Improvement |
|---|---|---|---|---|
| 2025 | $2,033 | $204,327 | $25,000 | $179,327 |
| 2024 | $1,540 | $125,699 | $10,012 | $115,687 |
| 2023 | $1,532 | $125,699 | $10,012 | $115,687 |
| 2022 | $1,510 | $123,840 | $10,012 | $113,828 |
| 2021 | $1,517 | $123,840 | $10,012 | $113,828 |
| 2020 | $1,325 | $104,859 | $10,012 | $94,847 |
| 2019 | $1,325 | $104,859 | $10,012 | $94,847 |
| 2018 | $1,324 | $104,859 | $10,012 | $94,847 |
| 2017 | $1,291 | $104,859 | $10,012 | $94,847 |
| 2016 | $1,295 | $104,859 | $10,012 | $94,847 |
| 2015 | $1,366 | $116,690 | $10,012 | $106,678 |
| 2014 | $1,366 | $116,690 | $10,012 | $106,678 |
Source: Public Records
Map
Nearby Homes
- 902 Linney Ln Unit A
- 904 Linney Ln Unit 36
- 904 Linney Ln Unit A
- 904B Linney Ln
- 902b Linney Ln
- 906 Linney Ln
- 903 Linney Ln Unit A
- 903 Linney Ln Unit A
- 903 Linney Ln
- 905 Linney Ln Unit 35
- 905 Linney Ln Unit B
- 905 Linney Ln
- 905 Linney Ln Unit A
- 605 Leander St
- 607 Leander St
- 603 Leander St
- 609 Leander St
- 805 Kirby St
- 806 Kirby St
- 601 Leander St