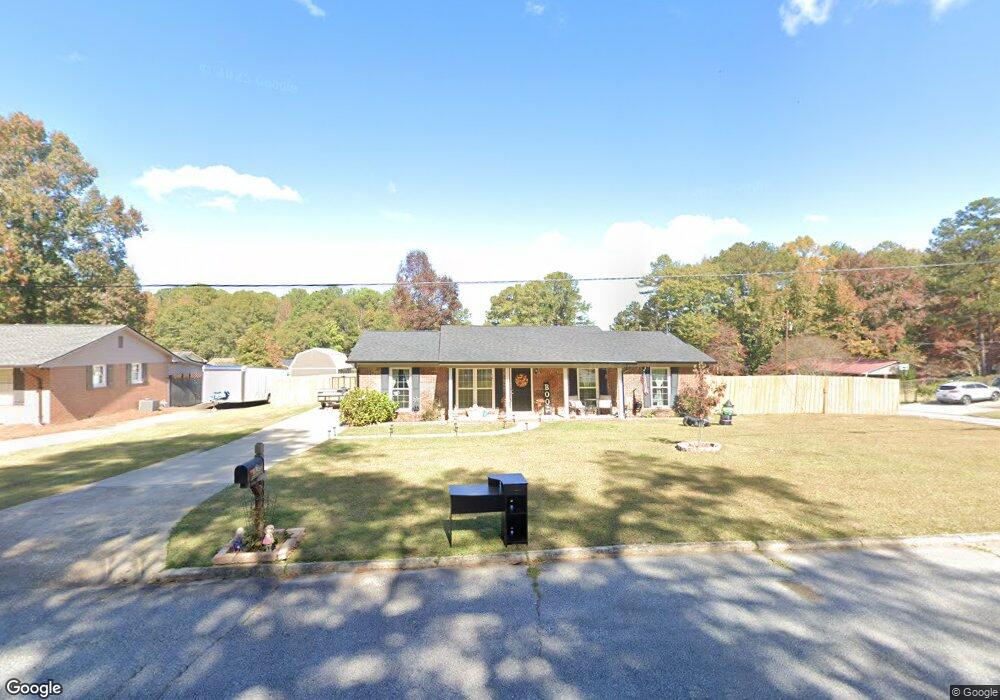
902 Mccurdy Blvd Manchester, GA 31816
Estimated Value: $146,438 - $183,000
3
Beds
2
Baths
1,456
Sq Ft
$112/Sq Ft
Est. Value
About This Home
This home is located at 902 Mccurdy Blvd, Manchester, GA 31816 and is currently estimated at $163,360, approximately $112 per square foot. 902 Mccurdy Blvd is a home located in Meriwether County with nearby schools including Mountain View Elementary School, Manchester Middle School, and Manchester High School.
Ownership History
Date
Name
Owned For
Owner Type
Purchase Details
Closed on
Dec 30, 2020
Sold by
Worsley Adam M
Bought by
Reeve Ashley
Current Estimated Value
Home Financials for this Owner
Home Financials are based on the most recent Mortgage that was taken out on this home.
Original Mortgage
$89,839
Outstanding Balance
$79,073
Interest Rate
2.71%
Mortgage Type
New Conventional
Estimated Equity
$84,287
Purchase Details
Closed on
Feb 27, 2004
Sold by
Daniel William Earne
Bought by
Worsley Adam Murray and Worsley
Purchase Details
Closed on
Jan 19, 1996
Sold by
Daniel Karen
Bought by
Daniel William Earne
Purchase Details
Closed on
Jan 5, 1996
Sold by
Dresher John R and Dresher Ros
Bought by
Daniel Karen
Purchase Details
Closed on
Mar 26, 1992
Sold by
Lee Marlin and Lee Marsha
Bought by
Dresher John R and Dresher Ros
Purchase Details
Closed on
Jan 1, 1985
Bought by
Lee Marlin and Lee Marsha
Create a Home Valuation Report for This Property
The Home Valuation Report is an in-depth analysis detailing your home's value as well as a comparison with similar homes in the area
Home Values in the Area
Average Home Value in this Area
Purchase History
| Date | Buyer | Sale Price | Title Company |
|---|---|---|---|
| Reeve Ashley | $82,000 | -- | |
| Worsley Adam Murray | $78,000 | -- | |
| Daniel William Earne | -- | -- | |
| Daniel Karen | $50,900 | -- | |
| Dresher John R | $48,000 | -- | |
| Lee Marlin | $46,500 | -- |
Source: Public Records
Mortgage History
| Date | Status | Borrower | Loan Amount |
|---|---|---|---|
| Open | Reeve Ashley | $89,839 |
Source: Public Records
Tax History
| Year | Tax Paid | Tax Assessment Tax Assessment Total Assessment is a certain percentage of the fair market value that is determined by local assessors to be the total taxable value of land and additions on the property. | Land | Improvement |
|---|---|---|---|---|
| 2025 | $1,832 | $53,360 | $3,720 | $49,640 |
| 2024 | $1,822 | $51,880 | $3,720 | $48,160 |
| 2023 | $1,543 | $33,120 | $3,720 | $29,400 |
| 2022 | $1,543 | $33,120 | $3,720 | $29,400 |
| 2021 | $983 | $33,120 | $3,720 | $29,400 |
| 2020 | $1,064 | $33,120 | $3,720 | $29,400 |
| 2019 | $1,068 | $33,120 | $3,720 | $29,400 |
| 2018 | $1,079 | $33,120 | $3,720 | $29,400 |
| 2017 | $1,092 | $33,120 | $3,720 | $29,400 |
| 2016 | $1,090 | $33,120 | $3,720 | $29,400 |
| 2015 | $1,092 | $33,120 | $3,720 | $29,400 |
| 2014 | $1,092 | $33,120 | $3,720 | $29,400 |
| 2013 | -- | $33,120 | $3,720 | $29,400 |
Source: Public Records
Map
Nearby Homes
- 825 Mccurdy Blvd
- 921 Mccurdy Blvd
- 403 W Broxton Ln
- 604 Farris Blvd
- 514 Farris Blvd
- 731 Jenni Ln
- 7223 Scenic Heights
- 116 8th Ave
- 709 Jenni Ln
- 7020 Scenic Heights
- 617 Mayes Way
- 6900 Scenic Heights
- 504 Webster Dr
- 0 W Main St Unit 228104
- 505 Chafin Dr
- 522 4th St
- 410 W 3rd St
- 802 Jd Parham Dr
- 307 3rd Ave
- 312 2nd Ave
- 604 Windsor Dr
- 904 Mccurdy Blvd
- 0 Mc Curdy Blvd Unit 184570
- 0 Mc Curdy Blvd Unit 9046953
- 0 Mc Curdy Blvd Unit 215594
- 0 Mc Curdy Blvd Unit 8950988
- 0 Mc Curdy Blvd Unit 8824785
- 822 Mccurdy Blvd
- 823 Mccurdy Blvd
- 906 Mccurdy Blvd
- 903 Linda Ln
- 901 Linda Ln
- 821 Mccurdy Blvd
- 820 Mccurdy Blvd
- 603 Windsor Dr
- 905 Linda Ln
- 785 Karen Dr
- 901 Mccurdy Blvd
- 907 Linda Ln
- 518 Windsor Dr
Your Personal Tour Guide
Ask me questions while you tour the home.