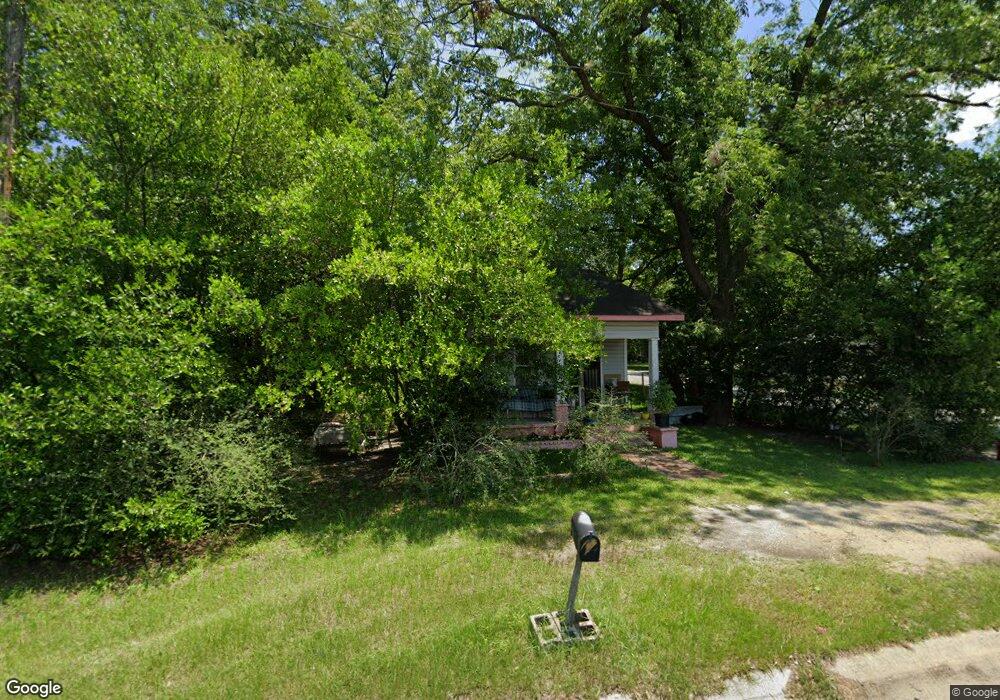
902 N 11th St Cordele, GA 31015
Estimated Value: $36,000 - $94,000
2
Beds
1
Bath
864
Sq Ft
$64/Sq Ft
Est. Value
About This Home
This home is located at 902 N 11th St, Cordele, GA 31015 and is currently estimated at $55,163, approximately $63 per square foot. 902 N 11th St is a home located in Crisp County with nearby schools including Crisp County Elementary School, Crisp County Primary School, and Crisp County Middle School.
Ownership History
Date
Name
Owned For
Owner Type
Purchase Details
Closed on
Jun 18, 2009
Sold by
Cross Martha Ann
Bought by
Brown Sandra Faye
Current Estimated Value
Home Financials for this Owner
Home Financials are based on the most recent Mortgage that was taken out on this home.
Original Mortgage
$4,250
Interest Rate
4.79%
Mortgage Type
Future Advance Clause Open End Mortgage
Purchase Details
Closed on
Oct 21, 2003
Sold by
Cross Jewel
Bought by
Cross Martha Ann
Purchase Details
Closed on
Apr 13, 2000
Sold by
Cross Ossie Lee
Bought by
Cross Jewel
Purchase Details
Closed on
Jan 17, 1968
Bought by
Cross Ossie Lee
Create a Home Valuation Report for This Property
The Home Valuation Report is an in-depth analysis detailing your home's value as well as a comparison with similar homes in the area
Home Values in the Area
Average Home Value in this Area
Purchase History
| Date | Buyer | Sale Price | Title Company |
|---|---|---|---|
| Brown Sandra Faye | $5,000 | -- | |
| Cross Martha Ann | -- | -- | |
| Cross Jewel | -- | -- | |
| Cross Ossie Lee | -- | -- |
Source: Public Records
Mortgage History
| Date | Status | Borrower | Loan Amount |
|---|---|---|---|
| Closed | Brown Sandra Faye | $4,250 |
Source: Public Records
Tax History Compared to Growth
Tax History
| Year | Tax Paid | Tax Assessment Tax Assessment Total Assessment is a certain percentage of the fair market value that is determined by local assessors to be the total taxable value of land and additions on the property. | Land | Improvement |
|---|---|---|---|---|
| 2025 | $266 | $8,114 | $833 | $7,281 |
| 2024 | $266 | $7,427 | $833 | $6,594 |
| 2023 | $266 | $7,084 | $833 | $6,251 |
| 2022 | $178 | $6,740 | $833 | $5,907 |
| 2021 | $175 | $6,397 | $833 | $5,564 |
| 2020 | $180 | $6,397 | $833 | $5,564 |
| 2019 | $317 | $11,189 | $833 | $10,356 |
| 2018 | $301 | $10,221 | $1,167 | $9,054 |
| 2017 | $415 | $10,221 | $1,167 | $9,054 |
| 2016 | $302 | $10,221 | $1,167 | $9,054 |
| 2015 | -- | $10,221 | $1,167 | $9,054 |
| 2014 | -- | $10,221 | $1,167 | $9,054 |
| 2013 | -- | $10,221 | $1,166 | $9,054 |
Source: Public Records
Map
Nearby Homes