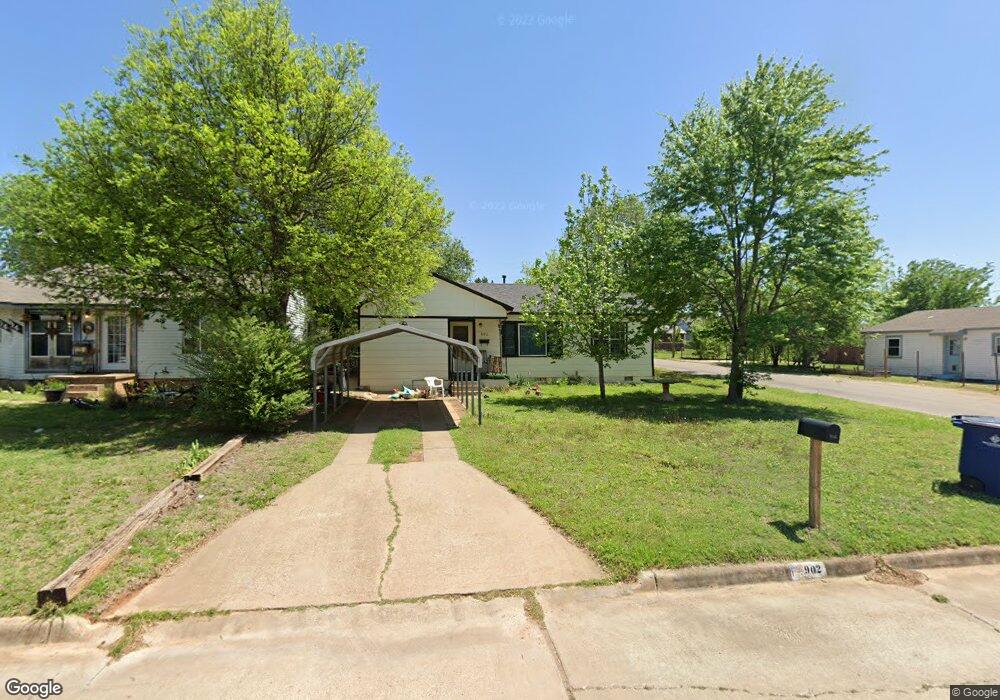
902 N C St Duncan, OK 73533
Estimated Value: $49,000 - $89,000
2
Beds
1
Bath
1,121
Sq Ft
$56/Sq Ft
Est. Value
About This Home
This home is located at 902 N C St, Duncan, OK 73533 and is currently estimated at $62,399, approximately $55 per square foot. 902 N C St is a home located in Stephens County with nearby schools including Woodrow Wilson Elementary School, Duncan Middle School, and Duncan High School.
Ownership History
Date
Name
Owned For
Owner Type
Purchase Details
Closed on
Sep 1, 2005
Sold by
Adams Joe B and Adams Carol J
Bought by
Hanson Charles E and Hanson Karen
Current Estimated Value
Home Financials for this Owner
Home Financials are based on the most recent Mortgage that was taken out on this home.
Original Mortgage
$31,000
Outstanding Balance
$16,441
Interest Rate
5.81%
Mortgage Type
Purchase Money Mortgage
Estimated Equity
$45,958
Purchase Details
Closed on
Apr 11, 2002
Sold by
The Cit Group
Purchase Details
Closed on
Mar 11, 2002
Sold by
Stephens County Sheriff
Purchase Details
Closed on
Dec 11, 1996
Sold by
Stricklin Rocky J
Create a Home Valuation Report for This Property
The Home Valuation Report is an in-depth analysis detailing your home's value as well as a comparison with similar homes in the area
Purchase History
| Date | Buyer | Sale Price | Title Company |
|---|---|---|---|
| Hanson Charles E | $33,000 | None Available | |
| -- | $11,500 | -- | |
| -- | -- | -- | |
| -- | $17,500 | -- |
Source: Public Records
Mortgage History
| Date | Status | Borrower | Loan Amount |
|---|---|---|---|
| Open | Hanson Charles E | $31,000 |
Source: Public Records
Tax History
| Year | Tax Paid | Tax Assessment Tax Assessment Total Assessment is a certain percentage of the fair market value that is determined by local assessors to be the total taxable value of land and additions on the property. | Land | Improvement |
|---|---|---|---|---|
| 2025 | $317 | $3,767 | $356 | $3,411 |
| 2024 | $291 | $3,417 | $356 | $3,061 |
| 2023 | $291 | $3,417 | $356 | $3,061 |
| 2022 | $263 | $3,220 | $356 | $2,864 |
| 2021 | $263 | $3,099 | $356 | $2,743 |
| 2020 | $243 | $2,811 | $356 | $2,455 |
| 2019 | $145 | $2,678 | $356 | $2,322 |
| 2018 | $158 | $2,775 | $356 | $2,419 |
| 2017 | $174 | $3,020 | $356 | $2,664 |
| 2016 | $256 | $4,015 | $356 | $3,659 |
| 2015 | $277 | $4,015 | $356 | $3,659 |
| 2014 | $277 | $4,015 | $356 | $3,659 |
Source: Public Records
Map
Nearby Homes
Your Personal Tour Guide
Ask me questions while you tour the home.