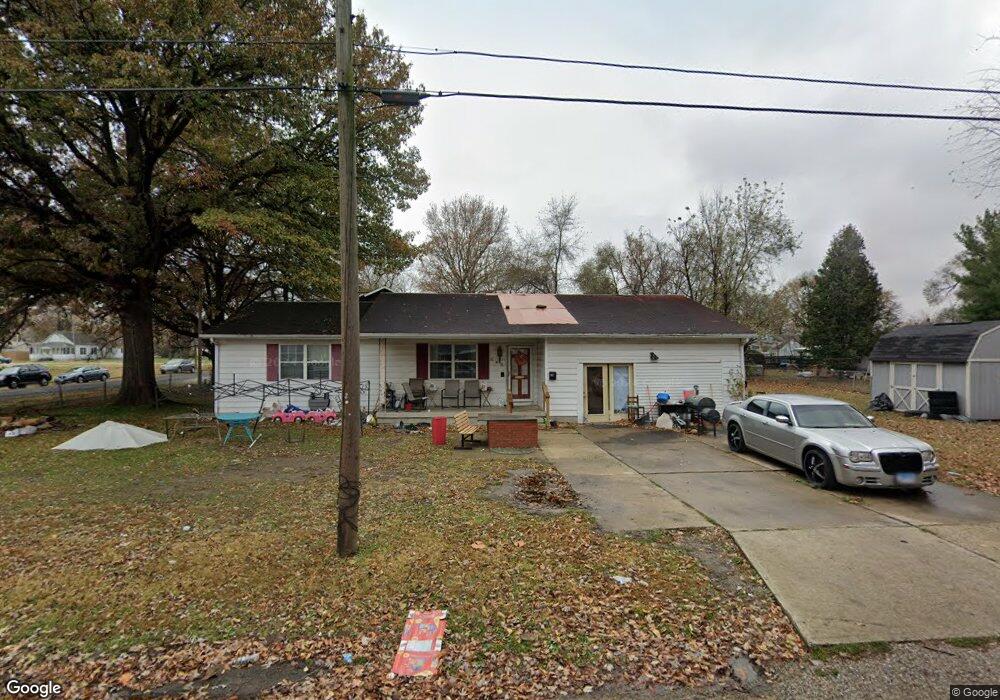
902 N Maple St Centralia, IL 62801
Estimated Value: $53,000 - $103,137
2
Beds
2
Baths
1,280
Sq Ft
$62/Sq Ft
Est. Value
About This Home
This home is located at 902 N Maple St, Centralia, IL 62801 and is currently estimated at $79,034, approximately $61 per square foot. 902 N Maple St is a home located in Marion County with nearby schools including Centralia High School, St. Mary School, and Trinity Lutheran School.
Ownership History
Date
Name
Owned For
Owner Type
Purchase Details
Closed on
Jun 28, 2017
Sold by
Marion County Tax Deed Clerk
Bought by
Sabre Investments Llc
Current Estimated Value
Purchase Details
Closed on
Sep 9, 2016
Sold by
Galiher Penny
Bought by
Skibinski Orland
Purchase Details
Closed on
Sep 23, 2011
Sold by
Hardy Patrice
Bought by
Skibinski Orland and Skibinski Penny
Home Financials for this Owner
Home Financials are based on the most recent Mortgage that was taken out on this home.
Original Mortgage
$30,700
Interest Rate
4.14%
Mortgage Type
Purchase Money Mortgage
Purchase Details
Closed on
Sep 9, 2011
Sold by
Hardy Patrice
Bought by
Skibinski Orland and Skibinski Penny
Home Financials for this Owner
Home Financials are based on the most recent Mortgage that was taken out on this home.
Original Mortgage
$30,700
Interest Rate
4.14%
Mortgage Type
Purchase Money Mortgage
Create a Home Valuation Report for This Property
The Home Valuation Report is an in-depth analysis detailing your home's value as well as a comparison with similar homes in the area
Home Values in the Area
Average Home Value in this Area
Purchase History
| Date | Buyer | Sale Price | Title Company |
|---|---|---|---|
| Sabre Investments Llc | -- | -- | |
| Skibinski Orland | -- | -- | |
| Skibinski Orland | $33,000 | Ouad County Title Co Inc | |
| Skibinski Orland | $33,000 | Quad County Title Company In |
Source: Public Records
Mortgage History
| Date | Status | Borrower | Loan Amount |
|---|---|---|---|
| Previous Owner | Skibinski Orland | $30,700 | |
| Previous Owner | Skibinski Orland | $30,700 |
Source: Public Records
Tax History
| Year | Tax Paid | Tax Assessment Tax Assessment Total Assessment is a certain percentage of the fair market value that is determined by local assessors to be the total taxable value of land and additions on the property. | Land | Improvement |
|---|---|---|---|---|
| 2024 | $2,504 | $32,160 | $1,990 | $30,170 |
| 2023 | $2,465 | $28,670 | $1,320 | $27,350 |
| 2022 | $2,413 | $26,060 | $1,200 | $24,860 |
| 2021 | $2,394 | $24,350 | $1,120 | $23,230 |
| 2020 | $2,364 | $23,630 | $1,090 | $22,540 |
| 2019 | $2,316 | $22,760 | $1,050 | $21,710 |
| 2018 | $2,356 | $22,760 | $1,050 | $21,710 |
| 2017 | $1,717 | $22,310 | $1,030 | $21,280 |
| 2016 | $1,699 | $21,450 | $990 | $20,460 |
| 2015 | $17 | $21,450 | $990 | $20,460 |
| 2012 | $25 | $23,460 | $1,880 | $21,580 |
Source: Public Records
Map
Nearby Homes
- 607 N Poplar St
- 1001 N Poplar St
- 518 E Kerr St
- 641 N Hickory St
- 226 N Lincoln Blvd Unit 1
- 120 N Sycamore St
- 873 E Noleman St
- 528 E Broadway
- 875 Martin Luther King Junior Dr
- 242 Watson St
- 910 E Mccord St
- 220 S Marion St
- 424 N College St
- 838 E 2nd St Unit 846
- 404 N Beech St
- 962 E Broadway
- 226 S Pine St
- 404 W Broadway
- 1201 E Noleman St
- 334 S Lincoln Blvd