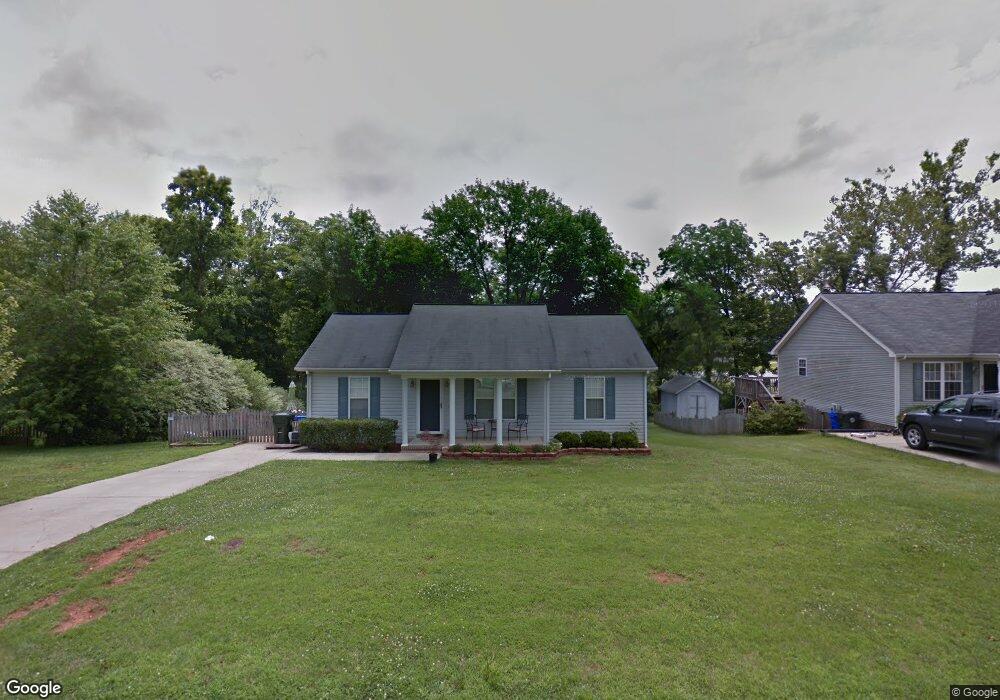
902 N Third St Mebane, NC 27302
Estimated Value: $262,000 - $293,000
2
Beds
2
Baths
1,066
Sq Ft
$265/Sq Ft
Est. Value
About This Home
This home is located at 902 N Third St, Mebane, NC 27302 and is currently estimated at $282,524, approximately $265 per square foot. 902 N Third St is a home located in Alamance County with nearby schools including E.M. Yoder Elementary School, Woodlawn Middle School, and Eastern Alamance High School.
Ownership History
Date
Name
Owned For
Owner Type
Purchase Details
Closed on
Sep 20, 2017
Sold by
Duke Elaine and Goldburg David
Bought by
Goldburg Elaine and Goldburg David
Current Estimated Value
Home Financials for this Owner
Home Financials are based on the most recent Mortgage that was taken out on this home.
Original Mortgage
$149,785
Outstanding Balance
$124,946
Interest Rate
3.86%
Mortgage Type
New Conventional
Estimated Equity
$157,578
Purchase Details
Closed on
Mar 23, 2005
Sold by
Bass Benita J
Bought by
Duke Elaine
Home Financials for this Owner
Home Financials are based on the most recent Mortgage that was taken out on this home.
Original Mortgage
$89,600
Interest Rate
5.54%
Mortgage Type
New Conventional
Purchase Details
Closed on
Jul 18, 2000
Sold by
C & H Construction
Bought by
Bass Benita J
Home Financials for this Owner
Home Financials are based on the most recent Mortgage that was taken out on this home.
Original Mortgage
$100,000
Interest Rate
8.23%
Create a Home Valuation Report for This Property
The Home Valuation Report is an in-depth analysis detailing your home's value as well as a comparison with similar homes in the area
Home Values in the Area
Average Home Value in this Area
Purchase History
| Date | Buyer | Sale Price | Title Company |
|---|---|---|---|
| Goldburg Elaine | -- | None Available | |
| Duke Elaine | $112,000 | -- | |
| Bass Benita J | $100,000 | -- |
Source: Public Records
Mortgage History
| Date | Status | Borrower | Loan Amount |
|---|---|---|---|
| Open | Goldburg Elaine | $149,785 | |
| Closed | Duke Elaine | $89,600 | |
| Closed | Duke Elaine | $22,400 | |
| Previous Owner | Bass Benita J | $100,000 |
Source: Public Records
Tax History
| Year | Tax Paid | Tax Assessment Tax Assessment Total Assessment is a certain percentage of the fair market value that is determined by local assessors to be the total taxable value of land and additions on the property. | Land | Improvement |
|---|---|---|---|---|
| 2025 | $2,078 | $240,485 | $40,000 | $200,485 |
| 2024 | $2,018 | $240,485 | $40,000 | $200,485 |
| 2023 | $1,919 | $240,485 | $40,000 | $200,485 |
| 2022 | $1,327 | $119,035 | $32,000 | $87,035 |
| 2021 | $1,338 | $119,035 | $32,000 | $87,035 |
| 2020 | $1,350 | $119,035 | $32,000 | $87,035 |
| 2019 | $1,357 | $119,035 | $32,000 | $87,035 |
| 2018 | $0 | $119,035 | $32,000 | $87,035 |
| 2017 | $1,250 | $119,035 | $32,000 | $87,035 |
| 2016 | $1,278 | $119,398 | $30,000 | $89,398 |
| 2015 | $689 | $119,398 | $30,000 | $89,398 |
| 2014 | $630 | $119,398 | $30,000 | $89,398 |
Source: Public Records
Map
Nearby Homes
- 901 N Fifth St
- 205 Esteban Ct
- 209 E Dillard St
- 513 N Fifth St
- 104 W Brown St
- 707 N Ninth St
- 612 N Carr St
- 701 N Carr St
- 112 N Sixth St
- 409 Reinsman Ct
- 704 E Ashland Dr
- 607 Lebanon Rd
- 607 W Lebanon Rd
- Lot# 2 Highway 70 E
- 1240 Hammond Dr
- 1244 Hammond Dr
- 702 Village Lake Dr
- 1273 Hammond Dr
- 704 Village Lake Dr
- 1277 Hammond Dr
Your Personal Tour Guide
Ask me questions while you tour the home.