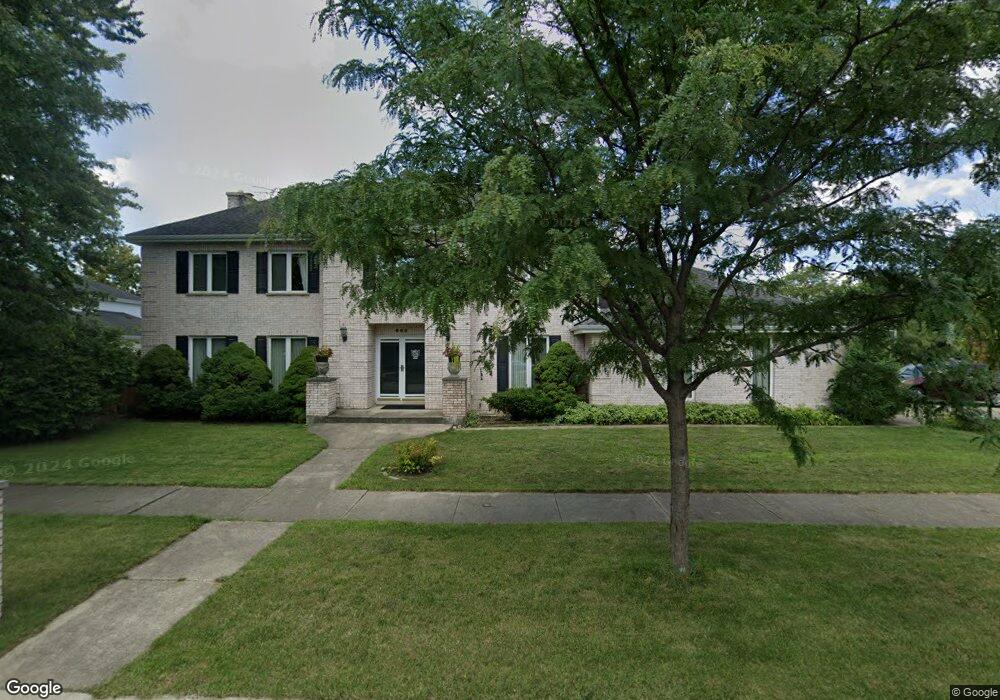
902 Neil Ln Unit 5 Glenview, IL 60025
Estimated Value: $896,594 - $1,018,000
4
Beds
3
Baths
3,212
Sq Ft
$297/Sq Ft
Est. Value
About This Home
This home is located at 902 Neil Ln Unit 5, Glenview, IL 60025 and is currently estimated at $953,899, approximately $296 per square foot. 902 Neil Ln Unit 5 is a home located in Cook County with nearby schools including Westbrook Elementary School, Glen Grove Elementary School, and Springman Middle School.
Ownership History
Date
Name
Owned For
Owner Type
Purchase Details
Closed on
Jul 1, 2003
Sold by
Laskin William Bradlyn and Renner Geralynn S
Bought by
Laplaca Joseph V and Laplaca Susan
Current Estimated Value
Home Financials for this Owner
Home Financials are based on the most recent Mortgage that was taken out on this home.
Original Mortgage
$290,000
Interest Rate
6.02%
Mortgage Type
Unknown
Purchase Details
Closed on
Jun 6, 1996
Sold by
Tessitore Salvatore V and Tessitore Mary E
Bought by
Laskin William Bradlyn and Renner Geralynn S
Home Financials for this Owner
Home Financials are based on the most recent Mortgage that was taken out on this home.
Original Mortgage
$395,000
Interest Rate
8.05%
Create a Home Valuation Report for This Property
The Home Valuation Report is an in-depth analysis detailing your home's value as well as a comparison with similar homes in the area
Home Values in the Area
Average Home Value in this Area
Purchase History
| Date | Buyer | Sale Price | Title Company |
|---|---|---|---|
| Laplaca Joseph V | $625,000 | Ltic | |
| Laskin William Bradlyn | $658,500 | 1St American Title |
Source: Public Records
Mortgage History
| Date | Status | Borrower | Loan Amount |
|---|---|---|---|
| Previous Owner | Laplaca Joseph V | $290,000 | |
| Previous Owner | Laskin William Bradlyn | $395,000 |
Source: Public Records
Tax History
| Year | Tax Paid | Tax Assessment Tax Assessment Total Assessment is a certain percentage of the fair market value that is determined by local assessors to be the total taxable value of land and additions on the property. | Land | Improvement |
|---|---|---|---|---|
| 2025 | $14,538 | $82,000 | $17,096 | $64,904 |
| 2024 | $14,538 | $69,000 | $14,505 | $54,495 |
| 2023 | $14,106 | $69,000 | $14,505 | $54,495 |
| 2022 | $14,106 | $69,000 | $14,505 | $54,495 |
| 2021 | $12,846 | $54,942 | $12,174 | $42,768 |
| 2020 | $12,750 | $54,942 | $12,174 | $42,768 |
| 2019 | $11,878 | $60,376 | $12,174 | $48,202 |
| 2018 | $13,236 | $60,984 | $10,620 | $50,364 |
| 2017 | $12,896 | $60,984 | $10,620 | $50,364 |
| 2016 | $12,862 | $63,301 | $10,620 | $52,681 |
| 2015 | $12,065 | $53,354 | $8,547 | $44,807 |
| 2014 | $11,857 | $53,354 | $8,547 | $44,807 |
| 2013 | $11,487 | $53,354 | $8,547 | $44,807 |
Source: Public Records
Map
Nearby Homes
- 10467 Dearlove Rd Unit 6
- 3925 Triumvera Dr Unit 10B
- 3801 Appian Way Unit 403
- 3732 Capri Ct Unit T18A
- 3700 Capri Ct Unit 510
- 3700 Capri Ct Unit 308
- 3843 Springdale Ave
- 1026 Castilian Ct Unit D162
- 701 Forum Square Unit 102
- 638 Naples Ct Unit T23C
- 1002 Castilian Ct Unit B302
- 10347 Dearlove Rd Unit 302
- 3505 Linneman St
- 1028 Highland Ln
- 911 Elmdale Rd
- 606 Greendale Rd
- 1223 Milwaukee Ave
- 9517 W Central Rd
- 524 Hazelwood Ln
- 3415 Ralmark Ln
Your Personal Tour Guide
Ask me questions while you tour the home.