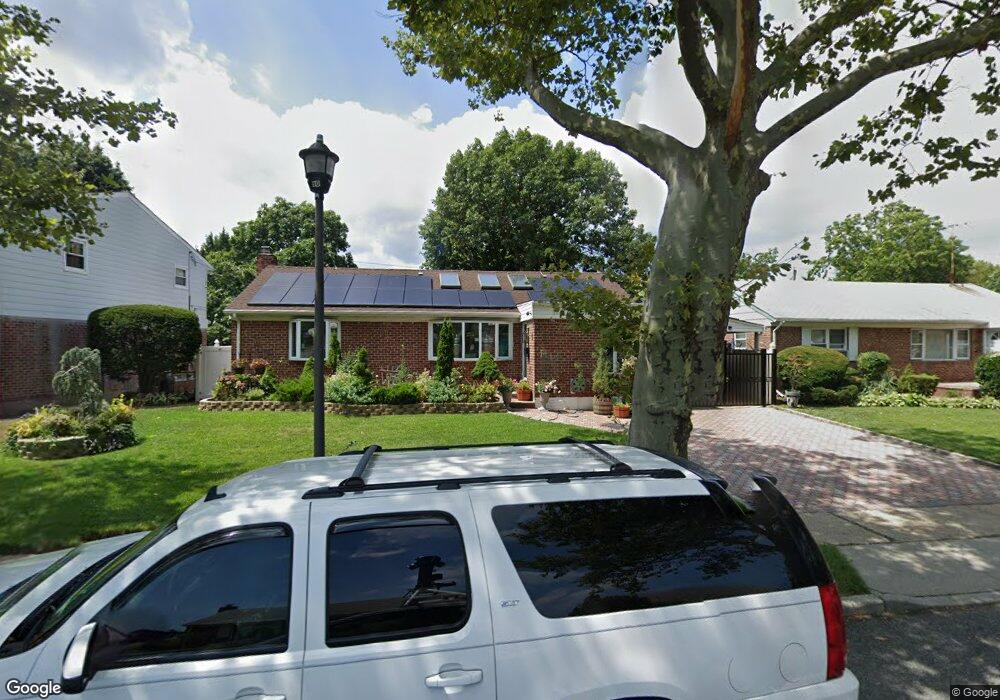
902 Niagara St Elmont, NY 11003
Estimated Value: $740,000 - $783,615
4
Beds
2
Baths
1,366
Sq Ft
$558/Sq Ft
Est. Value
About This Home
This home is located at 902 Niagara St, Elmont, NY 11003 and is currently estimated at $761,808, approximately $557 per square foot. 902 Niagara St is a home located in Nassau County with nearby schools including Hamza Academy, Cambria Center For The Gifted Child, and Martin De Porres School.
Ownership History
Date
Name
Owned For
Owner Type
Purchase Details
Closed on
Oct 19, 2015
Sold by
Sterling Emmanuel
Bought by
Sterling Emmanuel and Sterling Maureen Whyte
Current Estimated Value
Purchase Details
Closed on
Aug 28, 2014
Sold by
Property Tree Llc
Bought by
Sterling Emmanuel
Home Financials for this Owner
Home Financials are based on the most recent Mortgage that was taken out on this home.
Original Mortgage
$360,352
Outstanding Balance
$279,494
Interest Rate
4.5%
Mortgage Type
FHA
Estimated Equity
$482,314
Purchase Details
Closed on
Jan 23, 2013
Sold by
Prime Geoffrey N
Bought by
Skopp Steven
Create a Home Valuation Report for This Property
The Home Valuation Report is an in-depth analysis detailing your home's value as well as a comparison with similar homes in the area
Home Values in the Area
Average Home Value in this Area
Purchase History
| Date | Buyer | Sale Price | Title Company |
|---|---|---|---|
| Sterling Emmanuel | -- | All Way Abstract | |
| Sterling Emmanuel | $367,000 | -- | |
| Skopp Steven | -- | -- |
Source: Public Records
Mortgage History
| Date | Status | Borrower | Loan Amount |
|---|---|---|---|
| Open | Sterling Emmanuel | $360,352 |
Source: Public Records
Tax History Compared to Growth
Tax History
| Year | Tax Paid | Tax Assessment Tax Assessment Total Assessment is a certain percentage of the fair market value that is determined by local assessors to be the total taxable value of land and additions on the property. | Land | Improvement |
|---|---|---|---|---|
| 2025 | $12,863 | $530 | $244 | $286 |
| 2024 | $4,558 | $530 | $244 | $286 |
| 2023 | $12,408 | $530 | $244 | $286 |
| 2022 | $12,408 | $530 | $244 | $286 |
| 2021 | $16,991 | $506 | $233 | $273 |
| 2020 | $13,280 | $897 | $558 | $339 |
| 2019 | $13,725 | $863 | $558 | $305 |
| 2018 | $12,438 | $863 | $0 | $0 |
| 2017 | $7,084 | $863 | $558 | $305 |
| 2016 | $11,318 | $863 | $558 | $305 |
| 2015 | $3,933 | $863 | $558 | $305 |
| 2014 | $3,933 | $863 | $558 | $305 |
| 2013 | $3,687 | $863 | $558 | $305 |
Source: Public Records
Map
Nearby Homes
- 14 Albany St
- 956 Lynn Dr
- 1013 Stafford Rd
- 968 N Fletcher Ave
- 1747 Virginia Ave
- 866 Edwards Blvd
- 946 Edwards Blvd
- 6 Newburgh St
- 734 Dauntless Pkwy
- 1624 Sherbourne Rd
- 871 Val Park Ave
- 1571 Greenway Blvd
- 1138 Willow Ln
- 1147 Willow Ln
- 1133 Willow Ln
- 1002 Willow Ln
- 957 Dana Ave
- 1201 Willow Ln
- 802 Willow Ln Unit Upper Level
- 1219 Willow Ln