902 Niguel St Oceanside, CA 92057
North Valley NeighborhoodEstimated Value: $820,802 - $933,000
About This Home
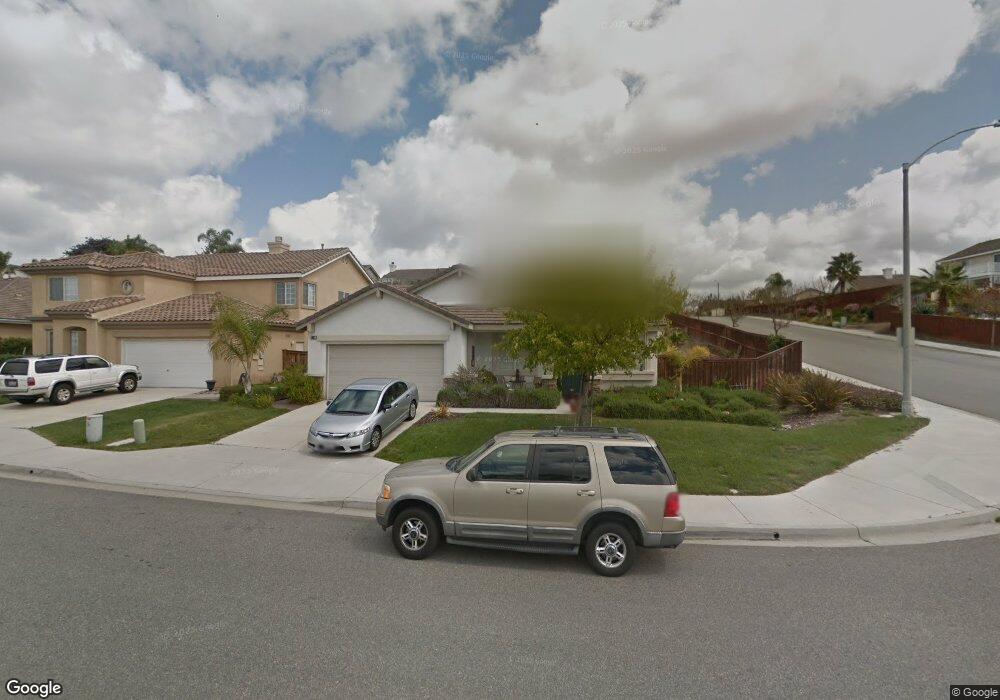
This home is located at 902 Niguel St, Oceanside, CA 92057 and is currently estimated at $873,451, approximately $544 per square foot. 902 Niguel St is a home located in San Diego County with nearby schools including Reynolds Elementary School, Cesar Chavez Middle School, and El Camino High School.
Ownership History
We collect this data history from publicly available records. To have your information removed, we recommend requesting removal directly through your county’s website.
Purchase Details
Home Financials for this Owner
Home Financials are based on the most recent Mortgage that was taken out on this home.Purchase Details
Home Financials for this Owner
Home Financials are based on the most recent Mortgage that was taken out on this home.Home Values in the Area
Average Home Value in this Area
Purchase History
We collect this data history from publicly available records. To have your information removed, we recommend requesting removal directly through your county’s website.
| Date | Buyer | Sale Price | Title Company |
|---|---|---|---|
| -- | Placer Title | ||
| $270,000 | Chicago Title |
Mortgage History
We collect this data history from publicly available records. To have your information removed, we recommend requesting removal directly through your county’s website.
| Date | Status | Borrower | Loan Amount |
|---|---|---|---|
| Open | $435,000 | ||
| Previous Owner | $229,491 |
Tax History
We collect this data history from publicly available records. To have your information removed, we recommend requesting removal directly through your county’s website.
| Year | Tax Paid | Tax Assessment Tax Assessment Total Assessment is a certain percentage of the fair market value that is determined by local assessors to be the total taxable value of land and additions on the property. | Land | Improvement |
|---|---|---|---|---|
| 2025 | $4,310 | $391,019 | $159,309 | $231,710 |
| 2024 | $4,310 | $383,353 | $156,186 | $227,167 |
| 2023 | $4,253 | $375,837 | $153,124 | $222,713 |
| 2022 | $4,109 | $368,469 | $150,122 | $218,347 |
| 2021 | $4,120 | $361,245 | $147,179 | $214,066 |
| 2020 | $3,993 | $357,542 | $145,670 | $211,872 |
| 2019 | $3,877 | $350,532 | $142,814 | $207,718 |
| 2018 | $3,834 | $343,660 | $140,014 | $203,646 |
| 2017 | $70 | $336,922 | $137,269 | $199,653 |
| 2016 | $3,638 | $330,317 | $134,578 | $195,739 |
| 2015 | $3,532 | $325,356 | $132,557 | $192,799 |
| 2014 | $3,396 | $318,984 | $129,961 | $189,023 |
Map
- 905 Glendora Dr
- 4901 Tropea St Unit II
- 671 Parker St
- 656 Parker St
- 980 Manteca Dr
- 635 Michael St
- 672 Arthur Ave
- 795 Via Callado
- 4908 Concho Place
- 5022 Calle Arquero
- 5146 E Parker St
- 5125 Eliot St
- 4969 Stephanie Place
- 5179 Via Mindanao
- 656 Roja St
- 1018 Bellingham Dr
- 1268 Bellingham Dr
- 5229 Harvest Ct
- 0 Indian View Dr
- 569 Gold Dr
- 906 Niguel St
- 910 Niguel St
- 898 Niguel St
- 901 Glendora Dr
- 893 Panella Dr
- 903 Niguel St
- 914 Niguel St
- 909 Glendora Dr
- 894 Niguel St
- 907 Niguel St
- 897 Panella Dr
- 911 Niguel St Unit II
- 913 Glendora Dr
- 4879 Castellano Dr
- 4897 Castellano Dr
- 890 Niguel St
- 918 Niguel St
- 896 Panella Dr Unit II
- 917 Glendora Dr
- 915 Niguel St
Ask me questions while you tour the home.