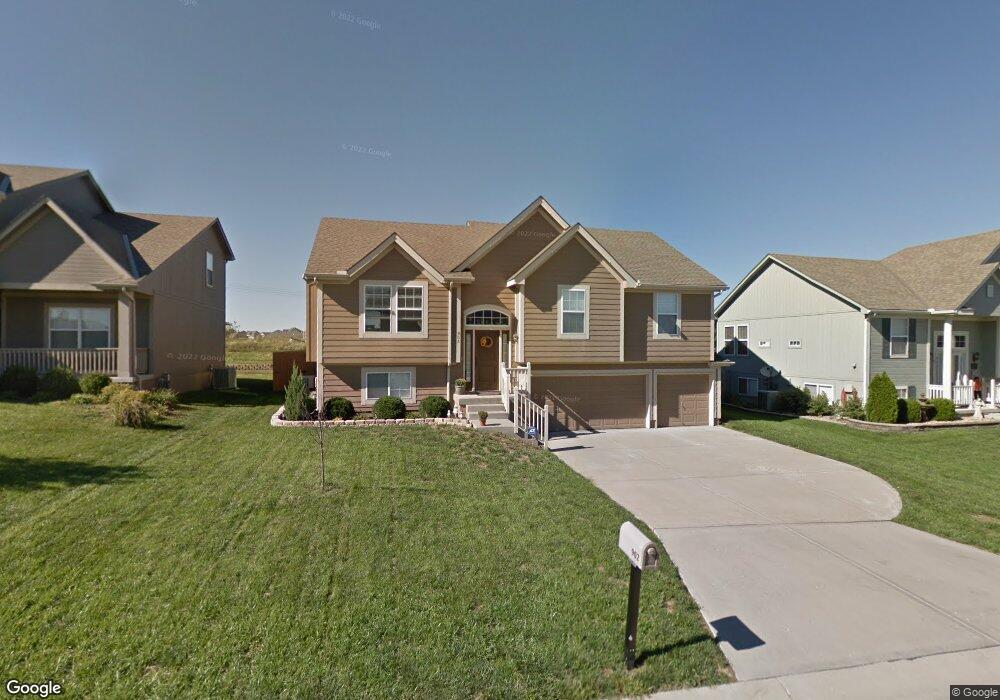
902 NW Hawthorne Ct Grain Valley, MO 64029
Estimated Value: $356,440 - $415,000
3
Beds
3
Baths
1,547
Sq Ft
$246/Sq Ft
Est. Value
About This Home
This home is located at 902 NW Hawthorne Ct, Grain Valley, MO 64029 and is currently estimated at $380,860, approximately $246 per square foot. 902 NW Hawthorne Ct is a home located in Jackson County with nearby schools including Grain Valley High School.
Ownership History
Date
Name
Owned For
Owner Type
Purchase Details
Closed on
Sep 14, 2017
Sold by
Chavez Josh and Chavez Erin
Bought by
Wagner Garrett and Wagner Lauren
Current Estimated Value
Purchase Details
Closed on
Jun 24, 2011
Sold by
Kelley Brett and Kelley Gretchen
Bought by
Chavez Josh and Chavez Erin
Purchase Details
Closed on
Dec 5, 2007
Sold by
Kansas City Regional Builders Llc
Bought by
Kelley Brett and Kelley Gretchen
Home Financials for this Owner
Home Financials are based on the most recent Mortgage that was taken out on this home.
Original Mortgage
$184,900
Interest Rate
6.4%
Mortgage Type
Purchase Money Mortgage
Purchase Details
Closed on
May 10, 2007
Sold by
Kimball Quality Construction Inc
Bought by
Kansas City Regional Builders Llc
Home Financials for this Owner
Home Financials are based on the most recent Mortgage that was taken out on this home.
Original Mortgage
$45,000
Interest Rate
6.22%
Mortgage Type
Purchase Money Mortgage
Create a Home Valuation Report for This Property
The Home Valuation Report is an in-depth analysis detailing your home's value as well as a comparison with similar homes in the area
Home Values in the Area
Average Home Value in this Area
Purchase History
| Date | Buyer | Sale Price | Title Company |
|---|---|---|---|
| Wagner Garrett | -- | Clt | |
| Chavez Josh | -- | Continental Title | |
| Kelley Brett | -- | Metro One Title | |
| Kansas City Regional Builders Llc | -- | Metro One Title |
Source: Public Records
Mortgage History
| Date | Status | Borrower | Loan Amount |
|---|---|---|---|
| Previous Owner | Kelley Brett | $184,900 | |
| Previous Owner | Kansas City Regional Builders Llc | $45,000 |
Source: Public Records
Tax History Compared to Growth
Tax History
| Year | Tax Paid | Tax Assessment Tax Assessment Total Assessment is a certain percentage of the fair market value that is determined by local assessors to be the total taxable value of land and additions on the property. | Land | Improvement |
|---|---|---|---|---|
| 2025 | $4,783 | $46,485 | $7,368 | $39,117 |
| 2024 | $4,783 | $58,072 | $6,249 | $51,823 |
| 2023 | $4,604 | $58,072 | $8,159 | $49,913 |
| 2022 | $3,186 | $35,150 | $5,700 | $29,450 |
| 2021 | $3,112 | $35,150 | $5,700 | $29,450 |
| 2020 | $3,153 | $35,126 | $5,700 | $29,426 |
| 2019 | $3,089 | $35,126 | $5,700 | $29,426 |
| 2018 | $3,108 | $33,031 | $4,657 | $28,374 |
| 2017 | $3,108 | $33,031 | $4,657 | $28,374 |
| 2016 | $2,920 | $31,046 | $6,118 | $24,928 |
| 2014 | $2,996 | $31,612 | $5,715 | $25,897 |
Source: Public Records
Map
Nearby Homes
- 809 NW Poplar Ct
- 952 NW Maplewood Ct
- 1103 NW Hickory Ct
- 912 NW Hickorywood Dr
- 2211 NW Hedgewood Dr
- 1310 NW Sycamore Dr
- 408 NW Rust Ct
- 816 NW Cedar Ln
- 1800 NW Mya Ct
- 1702 NW Hedgewood Dr
- 1515 NW Whispering Ct
- TBD E Duncan Rd
- 401 NW Europa Dr
- 801 NW Hickory Ridge Dr
- 803 NW Hickory Ridge Dr
- 1601 NW Nicholas Dr
- 1401 NW Hickory Ridge Ct
- 505 NW Whitney Dr
- 1403 NW Burr Oak Ct
- 1415 NE Jaclyn Dr
- 904 NW Hawthorne Ct
- 900 NW Hawthorne Ct
- 903 NW Hawthorne Ct
- 905 NW Hawthorne Ct
- 901 NW Hawthorne Ct
- 909 NW Persimmon Dr
- 907 NW Persimmon Dr
- 811 NW Hawthorn Ct
- 811 NW Hawthorn Ct
- 911 NW Persimmon Dr
- 906 NW Hawthorn Ct
- 905 NW Persimmon Dr
- 812 NW Hawthorne Ct
- 810 NW Hawthorne Ct
- 808 NW Hawthorne Ct
- 809 NW Hawthorne Ct
- 807 NW Hawthorne Ct
- 1005 NW Persimmon Dr
- 907 NW Hawthorne Ct
- 903 NW Persimmon Dr