902 Passolt St Saginaw, MI 48602
Saint Stephens Brockway-Carmen NeighborhoodEstimated Value: $144,000 - $177,000
3
Beds
2
Baths
1,230
Sq Ft
$130/Sq Ft
Est. Value
About This Home
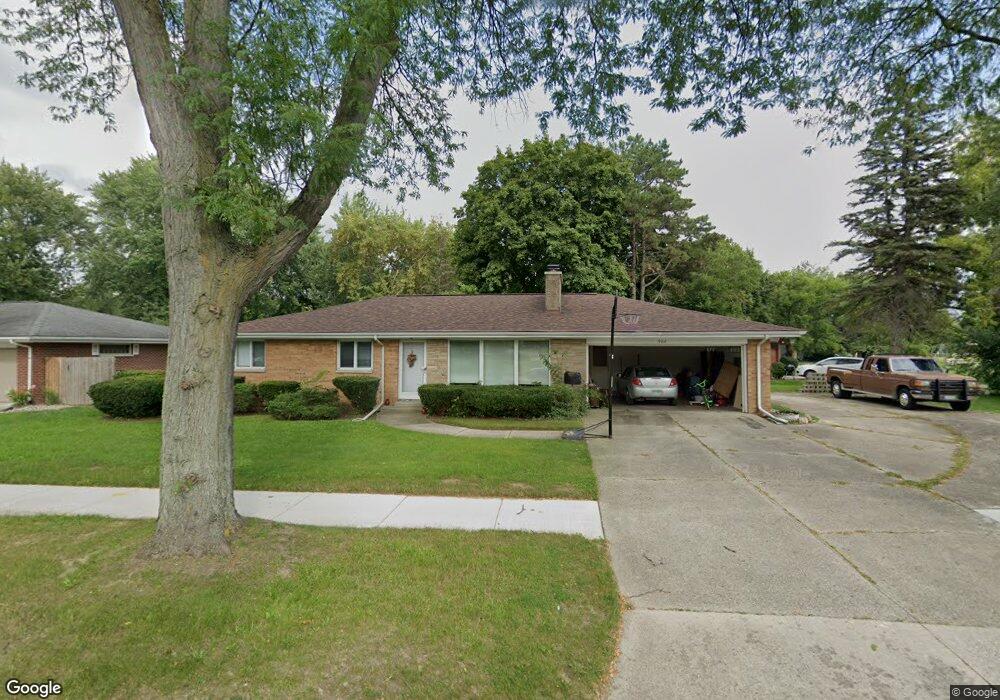
This home is located at 902 Passolt St, Saginaw, MI 48602 and is currently estimated at $159,771, approximately $129 per square foot. 902 Passolt St is a home located in Saginaw County with nearby schools including Chester F. Miller School, Thompson Middle School, and Arthur Hill High School.
Ownership History
Date
Name
Owned For
Owner Type
Purchase Details
Closed on
Sep 17, 2010
Sold by
Cianek Michael
Bought by
Roy Vicky P
Current Estimated Value
Home Financials for this Owner
Home Financials are based on the most recent Mortgage that was taken out on this home.
Original Mortgage
$61,669
Outstanding Balance
$40,743
Interest Rate
4.45%
Mortgage Type
FHA
Estimated Equity
$119,028
Purchase Details
Closed on
Mar 16, 1999
Sold by
Bekemeier Pauline S and Bekemeier John F
Bought by
Bekemeier Pauline S and Cianek Donna
Purchase Details
Closed on
Apr 1, 1997
Sold by
Ruppel Douglas H and Ruppel Linda L
Bought by
Bekemeier John F and Bekemeier Pauline S
Purchase Details
Closed on
Jul 6, 1994
Sold by
Ruppel Linda L
Bought by
Ruppel Douglas H and Ruppel Linda L
Purchase Details
Closed on
Jan 2, 1987
Sold by
Griffin Gloria J
Bought by
Sexton Linda L
Purchase Details
Closed on
Jun 1, 1979
Sold by
Schade Edward W and Schade Dorothy A
Bought by
Griffin Gloria J
Create a Home Valuation Report for This Property
The Home Valuation Report is an in-depth analysis detailing your home's value as well as a comparison with similar homes in the area
Home Values in the Area
Average Home Value in this Area
Purchase History
| Date | Buyer | Sale Price | Title Company |
|---|---|---|---|
| Roy Vicky P | $62,500 | -- | |
| Bekemeier Pauline S | -- | -- | |
| Bekemeier Pauline S | -- | -- | |
| Bekemeier John F | $84,000 | -- | |
| Ruppel Douglas H | -- | -- | |
| Sexton Linda L | $57,000 | -- | |
| Griffin Gloria J | $58,000 | -- |
Source: Public Records
Mortgage History
| Date | Status | Borrower | Loan Amount |
|---|---|---|---|
| Open | Roy Vicky P | $61,669 |
Source: Public Records
Tax History Compared to Growth
Tax History
| Year | Tax Paid | Tax Assessment Tax Assessment Total Assessment is a certain percentage of the fair market value that is determined by local assessors to be the total taxable value of land and additions on the property. | Land | Improvement |
|---|---|---|---|---|
| 2025 | $2,416 | $64,400 | $0 | $0 |
| 2024 | $1,898 | $59,100 | $0 | $0 |
| 2023 | $1,573 | $49,200 | $0 | $0 |
| 2022 | $1,981 | $42,200 | $0 | $0 |
| 2021 | $1,847 | $39,200 | $0 | $0 |
| 2020 | $1,613 | $35,500 | $0 | $0 |
| 2019 | $1,632 | $32,300 | $2,000 | $30,300 |
| 2018 | $1,296 | $35,008 | $0 | $0 |
| 2017 | $1,607 | $34,650 | $0 | $0 |
| 2016 | $1,593 | $34,250 | $0 | $0 |
| 2014 | -- | $36,414 | $0 | $34,310 |
| 2013 | -- | $36,511 | $0 | $0 |
Source: Public Records
Map
Nearby Homes
- 910 Passolt St
- 2025 Carman Dr
- 2011 Brockway St
- 1930 Brockway St
- 4270 Kirkwood Dr
- 215 Ardussi Ave
- 1902 Newberry St
- 1465 Glendale Ave
- 4386 Brockway Rd
- 807 Thurman St
- 1415 Coolidge Ave
- 643 Thurman St
- 1019 Hemmeter Rd
- 1737 Newberry St
- 1946 Gratiot Ave
- 0 Gratiot Ave
- 2517 Mackinaw St
- 1466 Wilson Ave
- 825 Baskins Place
- 200 Superior St
- 2150 Brockway St
- 1000 Passolt St
- 1031 Passolt St
- 2142 Brockway St
- 4030 Brockway Rd
- 2165 Heather Ln
- 1055 Passolt St
- 10 Shadyside Ct
- 2134 Brockway Rd
- 2159 Heather Ln
- 2134 Brockway St
- 2153 Heather Ln
- 4040 Brockway Rd
- 1071 Passolt St
- 2126 Brockway St
- 2145 Heather Ln
- 1050 Glendale Ave
- 1022 Passolt St
- 2160 Heather Ln
- 2131 Brockway St