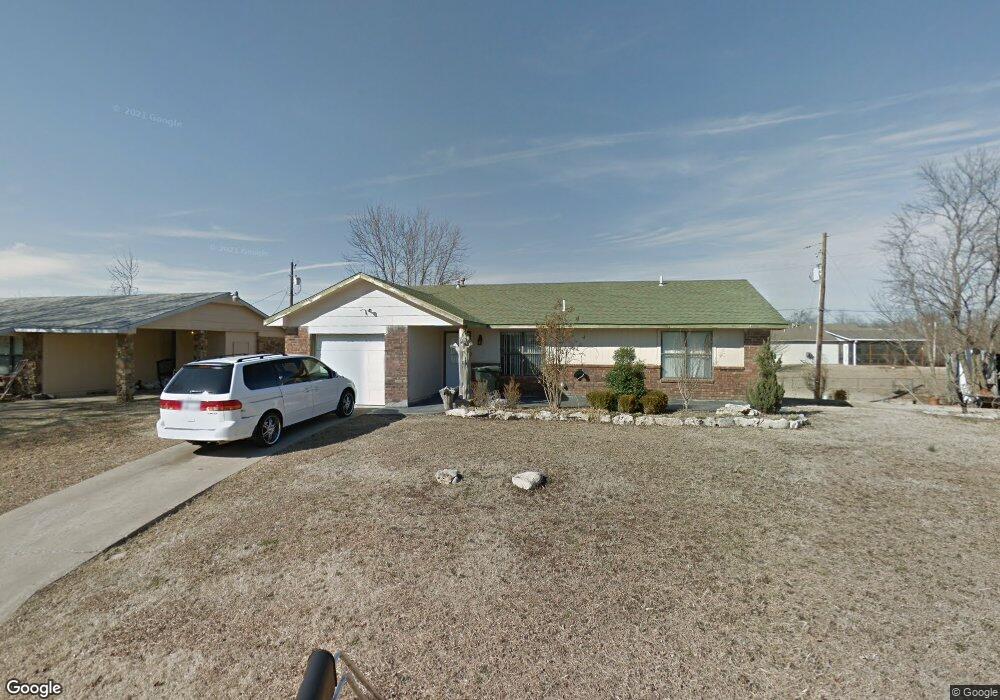
902 Pecan Ln Claremore, OK 74017
Estimated Value: $175,000 - $193,000
3
Beds
2
Baths
1,404
Sq Ft
$131/Sq Ft
Est. Value
About This Home
This home is located at 902 Pecan Ln, Claremore, OK 74017 and is currently estimated at $184,060, approximately $131 per square foot. 902 Pecan Ln is a home located in Rogers County with nearby schools including Claremont Elementary School, Will Rogers Junior High School, and Claremore High School.
Ownership History
Date
Name
Owned For
Owner Type
Purchase Details
Closed on
Dec 12, 2024
Sold by
Stimson Bonnie J and Stimson Terrance J
Bought by
Terry And Bonnie Stimson Trust and Stimson
Current Estimated Value
Purchase Details
Closed on
Sep 24, 2024
Sold by
Stimson Bonnie J and Stimson Terrance J
Bought by
Terry And Bonnie Stimson Trust and Stimson
Purchase Details
Closed on
Oct 16, 2014
Sold by
Santana Karla
Bought by
Stimson Terrance J and Stimson Bonnie J
Purchase Details
Closed on
Jun 19, 2009
Sold by
Johnny C Lamb and Johnny Linda M Lamb Revocablv
Bought by
Montelongo Leonel and Santana Karia
Purchase Details
Closed on
Dec 6, 2006
Sold by
Lamb Johnny C and Lamb Linda M
Bought by
Montelongo Leonel and Santana Karla
Purchase Details
Closed on
Feb 20, 2002
Sold by
Lamb Johnny C
Purchase Details
Closed on
Oct 19, 1904
Sold by
Harris John David
Create a Home Valuation Report for This Property
The Home Valuation Report is an in-depth analysis detailing your home's value as well as a comparison with similar homes in the area
Home Values in the Area
Average Home Value in this Area
Purchase History
| Date | Buyer | Sale Price | Title Company |
|---|---|---|---|
| Terry And Bonnie Stimson Trust | -- | None Listed On Document | |
| Terry And Bonnie Stimson Trust | -- | None Listed On Document | |
| Terry And Bonnie Stimson Trust | -- | None Listed On Document | |
| Terry And Bonnie Stimson Trust | -- | None Listed On Document | |
| Terry And Bonnie Stimson Trust | -- | None Listed On Document | |
| Stimson Terrance J | $61,500 | -- | |
| Montelongo Leonel | -- | None Available | |
| Montelongo Leonel | $75,000 | None Available | |
| -- | -- | -- | |
| -- | $29,500 | -- |
Source: Public Records
Tax History
| Year | Tax Paid | Tax Assessment Tax Assessment Total Assessment is a certain percentage of the fair market value that is determined by local assessors to be the total taxable value of land and additions on the property. | Land | Improvement |
|---|---|---|---|---|
| 2025 | $792 | $8,573 | $1,005 | $7,568 |
| 2024 | $755 | $8,165 | $957 | $7,208 |
| 2023 | $755 | $7,776 | $643 | $7,133 |
| 2022 | $686 | $7,406 | $110 | $7,296 |
| 2021 | $691 | $7,830 | $110 | $7,720 |
| 2020 | $709 | $7,917 | $110 | $7,807 |
| 2019 | $683 | $7,372 | $110 | $7,262 |
| 2018 | $737 | $7,981 | $110 | $7,871 |
| 2017 | $726 | $7,906 | $110 | $7,796 |
| 2016 | $720 | $7,674 | $110 | $7,564 |
| 2015 | $691 | $7,452 | $110 | $7,342 |
| 2014 | $744 | $9,020 | $1,155 | $7,865 |
Source: Public Records
Map
Nearby Homes
- 121 W 9th Place S
- 117 W 9th Place S
- 116 W 11th St
- 1007 S Choctaw Place
- 303 E Fry Place
- 507 S Maryland Ave
- 620 S Choctaw Ave
- 2010 S Missouri Ave
- 1400 W Eddy St
- 1203 W Missouri Ave
- 1100 Colhurst Ln
- 1414 W Bert St
- 321 E Patti Page Blvd
- 401 E Patti Page Blvd
- 402 E Patti Page Blvd
- 1 E 500 Rd
- 4 E 500 Rd
- 3 E 500 Rd
- 2 E 500 Rd
- 430 E Will Rogers Blvd
Your Personal Tour Guide
Ask me questions while you tour the home.