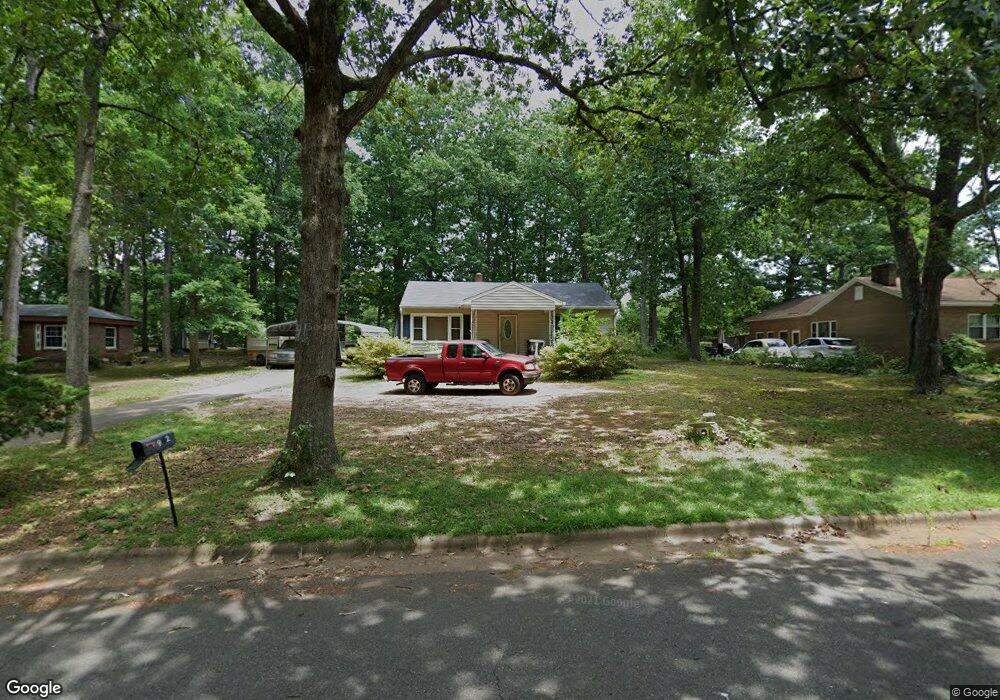
902 Rhodes Ave Kings Mountain, NC 28086
Estimated Value: $131,194 - $193,000
--
Bed
--
Bath
792
Sq Ft
$205/Sq Ft
Est. Value
About This Home
This home is located at 902 Rhodes Ave, Kings Mountain, NC 28086 and is currently estimated at $162,299, approximately $204 per square foot. 902 Rhodes Ave is a home located in Cleveland County with nearby schools including East Elementary School, Kings Mountain Middle, and Kings Mountain Intermediate School.
Ownership History
Date
Name
Owned For
Owner Type
Purchase Details
Closed on
Apr 24, 2015
Sold by
Simpson Susan
Bought by
Simpson Lisa
Current Estimated Value
Home Financials for this Owner
Home Financials are based on the most recent Mortgage that was taken out on this home.
Original Mortgage
$62,000
Outstanding Balance
$48,597
Interest Rate
4.25%
Mortgage Type
Adjustable Rate Mortgage/ARM
Estimated Equity
$113,702
Purchase Details
Closed on
Mar 18, 2008
Sold by
Barrett Louise Head
Bought by
Simpson Susan
Create a Home Valuation Report for This Property
The Home Valuation Report is an in-depth analysis detailing your home's value as well as a comparison with similar homes in the area
Home Values in the Area
Average Home Value in this Area
Purchase History
| Date | Buyer | Sale Price | Title Company |
|---|---|---|---|
| Simpson Lisa | $61,000 | None Available | |
| Simpson Susan | $46,000 | None Available |
Source: Public Records
Mortgage History
| Date | Status | Borrower | Loan Amount |
|---|---|---|---|
| Open | Simpson Lisa | $62,000 |
Source: Public Records
Tax History Compared to Growth
Tax History
| Year | Tax Paid | Tax Assessment Tax Assessment Total Assessment is a certain percentage of the fair market value that is determined by local assessors to be the total taxable value of land and additions on the property. | Land | Improvement |
|---|---|---|---|---|
| 2025 | $926 | $90,294 | $24,300 | $65,994 |
| 2024 | $761 | $63,060 | $22,680 | $40,380 |
| 2023 | $757 | $63,060 | $22,680 | $40,380 |
| 2022 | $726 | $63,060 | $22,680 | $40,380 |
| 2021 | $730 | $63,060 | $22,680 | $40,380 |
| 2020 | $659 | $55,348 | $22,680 | $32,668 |
| 2019 | $659 | $55,348 | $22,680 | $32,668 |
| 2018 | $657 | $55,348 | $22,680 | $32,668 |
| 2017 | $654 | $55,348 | $22,680 | $32,668 |
| 2016 | $655 | $55,348 | $22,680 | $32,668 |
| 2015 | $610 | $52,773 | $18,900 | $33,873 |
| 2014 | $610 | $52,773 | $18,900 | $33,873 |
Source: Public Records
Map
Nearby Homes