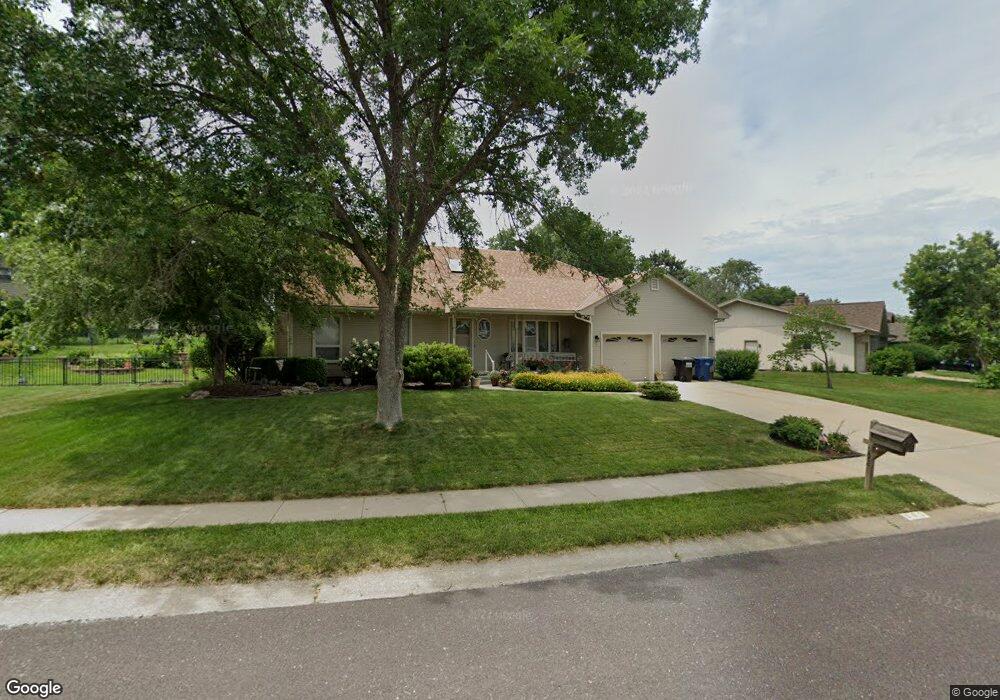
902 S Fillmore St Papillion, NE 68046
Estimated Value: $297,000 - $366,000
3
Beds
3
Baths
1,890
Sq Ft
$179/Sq Ft
Est. Value
About This Home
This home is located at 902 S Fillmore St, Papillion, NE 68046 and is currently estimated at $338,247, approximately $178 per square foot. 902 S Fillmore St is a home located in Sarpy County with nearby schools including Trumble Park Elementary School, Papillion Middle School, and Papillion La Vista South High School.
Ownership History
Date
Name
Owned For
Owner Type
Purchase Details
Closed on
Jan 18, 2024
Sold by
Krueger Rudolph V and Krueger Marilyn L
Bought by
Leach Scott B and Leach Sandra L
Current Estimated Value
Create a Home Valuation Report for This Property
The Home Valuation Report is an in-depth analysis detailing your home's value as well as a comparison with similar homes in the area
Home Values in the Area
Average Home Value in this Area
Purchase History
| Date | Buyer | Sale Price | Title Company |
|---|---|---|---|
| Leach Scott B | $340,000 | Aksarben Title |
Source: Public Records
Tax History Compared to Growth
Tax History
| Year | Tax Paid | Tax Assessment Tax Assessment Total Assessment is a certain percentage of the fair market value that is determined by local assessors to be the total taxable value of land and additions on the property. | Land | Improvement |
|---|---|---|---|---|
| 2025 | $4,004 | $292,813 | $51,000 | $241,813 |
| 2024 | $4,927 | $270,890 | $46,000 | $224,890 |
| 2023 | $4,927 | $261,656 | $42,000 | $219,656 |
| 2022 | $4,936 | $241,896 | $40,000 | $201,896 |
| 2021 | $4,665 | $224,079 | $37,000 | $187,079 |
| 2020 | $4,560 | $216,854 | $37,000 | $179,854 |
| 2019 | $4,250 | $202,245 | $34,000 | $168,245 |
| 2018 | $4,008 | $187,807 | $29,000 | $158,807 |
| 2017 | $3,834 | $179,737 | $27,000 | $152,737 |
| 2016 | $3,796 | $178,238 | $27,000 | $151,238 |
| 2015 | $3,693 | $173,890 | $27,000 | $146,890 |
| 2014 | $3,588 | $167,780 | $27,000 | $140,780 |
| 2012 | -- | $162,245 | $27,000 | $135,245 |
Source: Public Records
Map
Nearby Homes
- 906 Chisholm Trail
- 801 S Fillmore St
- Lot 71 N Shore Commercial
- Lot 39
- 12378 Lake Vista Dr
- 262 Ashbury Hills St
- 259 Ashbury Hils St
- 235 Lot St
- Lot 28 Ashbury Hills
- 907 Woodland Ave
- 613 Valley Rd
- Lot 130 Shadow Lake 2
- TBD Slayton St
- 809 Buckboard Blvd
- 704 Valley Rd
- 308 Crest Rd
- 309 S Fillmore St
- LOT 293 Granite Lake
- Lot 289 Granite Lake
- 1120 Delmar St Unit 4B
- 904 Chisholm Trail
- 902 Chisholm Trail
- 900 S Fillmore St
- 900 Chisholm Trail
- 907 S Fillmore St
- 903 S Fillmore St
- 810 S Fillmore St
- 908 Chisholm Trail
- 909 S Fillmore St
- 810 Chisholm Trail
- 901 S Fillmore St
- 808 S Fillmore St
- 900 Crest Rd
- 901 Lariat Cir
- 706 Gruenther St
- 811 S Fillmore St
- 808 Chisholm Trail
- 900 S Taylor St
- 809 S Fillmore St
- 806 S Fillmore St