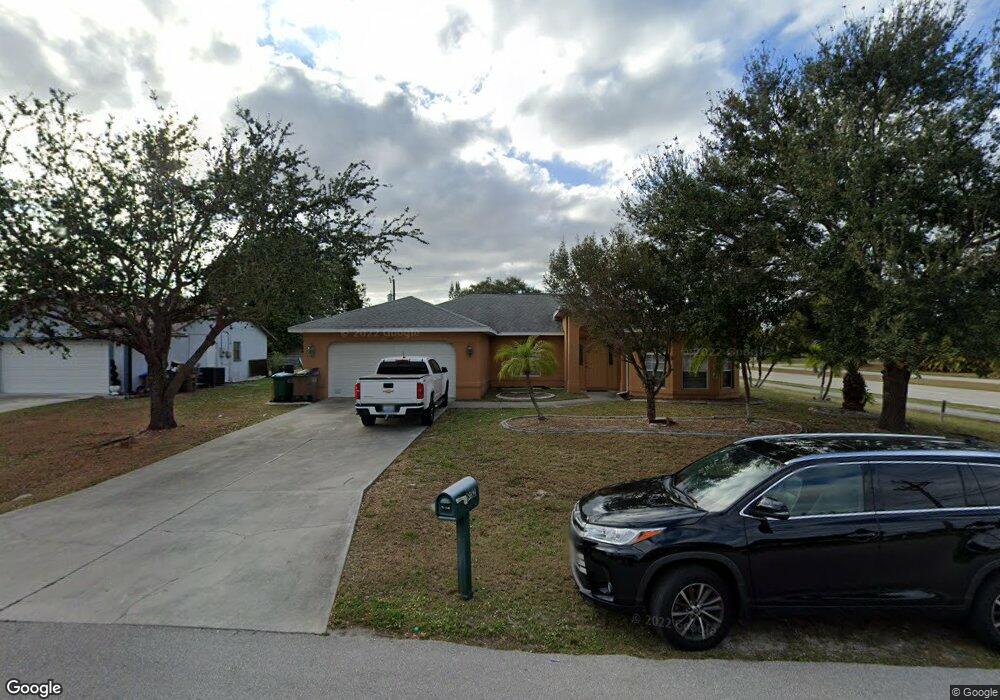
902 SE 20th Ct Cape Coral, FL 33990
Hancock NeighborhoodEstimated Value: $304,772 - $406,000
3
Beds
2
Baths
1,722
Sq Ft
$203/Sq Ft
Est. Value
About This Home
This home is located at 902 SE 20th Ct, Cape Coral, FL 33990 and is currently estimated at $349,943, approximately $203 per square foot. 902 SE 20th Ct is a home located in Lee County with nearby schools including Caloosa Elementary School, Tropic Isles Elementary School, and Hancock Creek Elementary School.
Ownership History
Date
Name
Owned For
Owner Type
Purchase Details
Closed on
Aug 20, 2008
Sold by
Wachovia Bank Na
Bought by
Torres Mayra
Current Estimated Value
Purchase Details
Closed on
Apr 15, 2008
Sold by
Gallego Paula
Bought by
Wachovia Bank Na and Holders Of Aegis Asset Backed Securities
Purchase Details
Closed on
Apr 28, 2003
Sold by
Heil Julie Cesar Zweiger and Zweiger Beatriz N
Bought by
Gallego Paula
Home Financials for this Owner
Home Financials are based on the most recent Mortgage that was taken out on this home.
Original Mortgage
$135,200
Interest Rate
5.79%
Purchase Details
Closed on
Nov 25, 2002
Sold by
Baywood Construction Inc
Bought by
Heil Julio Cesar Zweiger and Zweiger Beatriz N
Purchase Details
Closed on
Jan 13, 2002
Sold by
Newsom Mary
Bought by
Baywood Construction
Purchase Details
Closed on
Jan 4, 2002
Sold by
Reynolds Leigh Ann and Bourque Leigh
Bought by
Baywood Const
Create a Home Valuation Report for This Property
The Home Valuation Report is an in-depth analysis detailing your home's value as well as a comparison with similar homes in the area
Home Values in the Area
Average Home Value in this Area
Purchase History
| Date | Buyer | Sale Price | Title Company |
|---|---|---|---|
| Torres Mayra | $118,000 | Attorney | |
| Wachovia Bank Na | $2,000 | None Available | |
| Gallego Paula | $169,000 | -- | |
| Heil Julio Cesar Zweiger | $20,000 | -- | |
| Baywood Construction | -- | -- | |
| Baywood Const | $16,000 | -- |
Source: Public Records
Mortgage History
| Date | Status | Borrower | Loan Amount |
|---|---|---|---|
| Previous Owner | Gallego Paula | $135,200 |
Source: Public Records
Tax History Compared to Growth
Tax History
| Year | Tax Paid | Tax Assessment Tax Assessment Total Assessment is a certain percentage of the fair market value that is determined by local assessors to be the total taxable value of land and additions on the property. | Land | Improvement |
|---|---|---|---|---|
| 2025 | $4,955 | $251,208 | $72,675 | $178,533 |
| 2024 | $4,825 | $255,367 | -- | -- |
| 2023 | $4,825 | $232,152 | $0 | $0 |
| 2022 | $4,389 | $211,047 | $0 | $0 |
| 2021 | $3,934 | $192,382 | $31,000 | $161,382 |
| 2020 | $3,734 | $174,419 | $31,750 | $142,669 |
| 2019 | $3,531 | $164,723 | $25,000 | $139,723 |
| 2018 | $3,502 | $166,350 | $25,000 | $141,350 |
| 2017 | $3,419 | $171,208 | $18,000 | $153,208 |
| 2016 | $3,090 | $146,154 | $18,000 | $128,154 |
| 2015 | $2,842 | $126,594 | $14,500 | $112,094 |
| 2014 | $2,663 | $119,804 | $11,280 | $108,524 |
| 2013 | -- | $104,704 | $10,200 | $94,504 |
Source: Public Records
Map
Nearby Homes
- 940 SE 20th Ct
- 1927 SE 10th St
- 1025 SE 20th Ave
- 928 SE 21st Place
- 2117 SE 9th Terrace
- 2110 SE 10th Terrace
- 1062 SE 21st Ave
- 1814 SE 9th Terrace
- 1928 SE 11th Terrace
- 2210 SE 8th Terrace
- 1826 SE 6th Ln
- 2129 SE 6th Ln
- 2216 SE 8th Terrace
- 1725 SE 9th Terrace
- 2215 SE 10th Ln
- 1921 SE 12th St
- 2014 SE 12th St
- 1930 SE 12th St
- 2223 SE 10th Ln
- 2304 SE 8th Terrace
- 906 SE 20th Ct
- 2024 Viscaya Pkwy
- 910 SE 20th Ct
- 903 SE 20th Ct
- 909 SE 20th Place
- 826 SE 20th Ct
- 907 SE 20th Ct
- 827 SE 20th Place
- 911 SE 20th Ct
- 913 SE 20th Place
- 914 SE 20th Ct
- 822 SE 20th Ct
- 2016 Viscaya Pkwy
- 823 SE 20th Place
- 915 SE 20th Ct
- 917 SE 20th Place
- 2015 SE 9th Terrace
- 823 SE 20th Ct
- 918 SE 20th Ct
- 818 SE 20th Ct