Estimated Value: $510,000 - $580,000
3
Beds
3
Baths
2,330
Sq Ft
$230/Sq Ft
Est. Value
About This Home
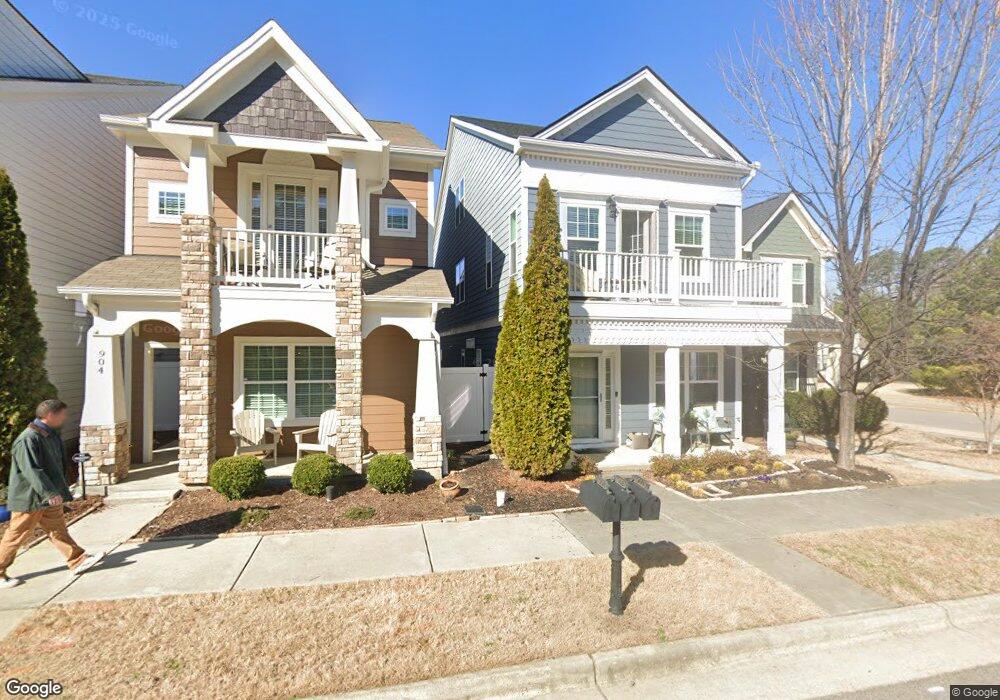
This home is located at 902 Shoofly Path, Apex, NC 27502 and is currently estimated at $536,753, approximately $230 per square foot. 902 Shoofly Path is a home located in Wake County with nearby schools including Salem Elementary, Salem Middle, and Apex High School.
Ownership History
Date
Name
Owned For
Owner Type
Purchase Details
Closed on
Mar 2, 2022
Sold by
Mullen David R and Mullen Patti G
Bought by
Parker Lynn
Current Estimated Value
Home Financials for this Owner
Home Financials are based on the most recent Mortgage that was taken out on this home.
Original Mortgage
$384,000
Outstanding Balance
$357,837
Interest Rate
3.69%
Mortgage Type
New Conventional
Estimated Equity
$178,916
Purchase Details
Closed on
Sep 29, 2017
Sold by
Venuti Scott A
Bought by
Mullen David R and Mullen Patti G
Home Financials for this Owner
Home Financials are based on the most recent Mortgage that was taken out on this home.
Original Mortgage
$260,000
Interest Rate
3.12%
Mortgage Type
Adjustable Rate Mortgage/ARM
Purchase Details
Closed on
Sep 26, 2013
Sold by
Experienceone Homes Llc
Bought by
Venuti Scott A
Home Financials for this Owner
Home Financials are based on the most recent Mortgage that was taken out on this home.
Original Mortgage
$232,820
Interest Rate
4.12%
Mortgage Type
Adjustable Rate Mortgage/ARM
Create a Home Valuation Report for This Property
The Home Valuation Report is an in-depth analysis detailing your home's value as well as a comparison with similar homes in the area
Purchase History
| Date | Buyer | Sale Price | Title Company |
|---|---|---|---|
| Parker Lynn | $480,000 | None Listed On Document | |
| Mullen David R | $326,000 | None Available | |
| Venuti Scott A | $245,500 | None Available |
Source: Public Records
Mortgage History
| Date | Status | Borrower | Loan Amount |
|---|---|---|---|
| Open | Parker Lynn | $384,000 | |
| Previous Owner | Mullen David R | $260,000 | |
| Previous Owner | Venuti Scott A | $232,820 |
Source: Public Records
Tax History
| Year | Tax Paid | Tax Assessment Tax Assessment Total Assessment is a certain percentage of the fair market value that is determined by local assessors to be the total taxable value of land and additions on the property. | Land | Improvement |
|---|---|---|---|---|
| 2025 | $4,619 | $526,763 | $105,000 | $421,763 |
| 2024 | $4,465 | $520,826 | $105,000 | $415,826 |
Source: Public Records
Map
Nearby Homes
- 917 Ambergate Station
- 929 Shoofly Path
- 996 Tender Dr
- 1007 Tender Dr
- 1019 Branch Line Ln
- 1091 Branch Line Ln
- 1808 N Salem St
- 811 Amley Place
- 1115 Platform Dr
- 1102 Brittley Way
- 1069 Danvers Loop
- 1124 Platform Dr
- 1011 Lathrop Ln
- 1003 Lathrop Ln
- 201 Pinewood Dr
- 810 Richmont Grove Ln
- 823 Richmont Grove Ln
- 904 Dalton Ridge Place
- 618 Metro Station
- 912 Brittley Way
- 904 Shoofly Path
- 900 Shoofly Path
- 906 Shoofly Path
- 908 Shoofly Path
- 912 Shoofly Path
- 1058 Marker Dr
- 1054 Marker Dr
- 914 Shoofly Path
- 901 Shoofly Path
- 916 Shoofly Path
- 901 Ambergate Station Unit 301
- 901 Ambergate Station
- 903 Ambergate Station
- 913 Ambergate Station
- 903 Shoofly Path
- 903 Shoofly Path Unit 251
- 909 Ambergate Station
- 909 Shoofly Path
- 905 Shoofly Path
- 905 Shoofly Path Unit 250
Your Personal Tour Guide
Ask me questions while you tour the home.