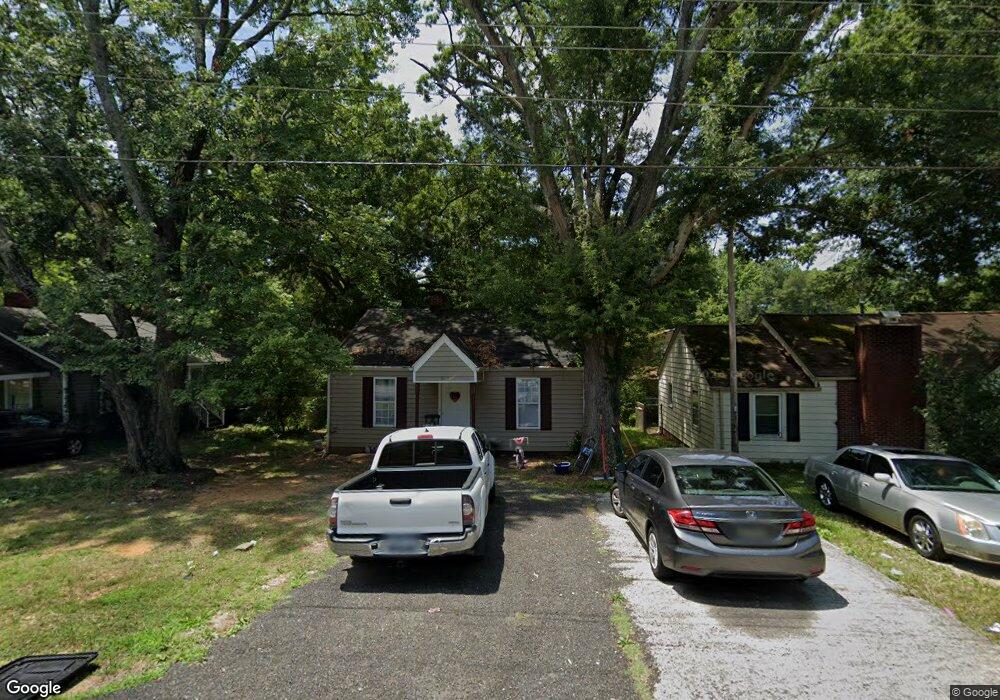
902 Skyland St Kannapolis, NC 28083
Estimated Value: $121,000 - $219,000
2
Beds
1
Bath
750
Sq Ft
$219/Sq Ft
Est. Value
About This Home
This home is located at 902 Skyland St, Kannapolis, NC 28083 and is currently estimated at $164,359, approximately $219 per square foot. 902 Skyland St is a home located in Cabarrus County with nearby schools including Jackson Park Elementary School, Kannapolis Middle, and A.L. Brown High School.
Ownership History
Date
Name
Owned For
Owner Type
Purchase Details
Closed on
Aug 28, 2019
Sold by
Georgiou Bill N
Bought by
Yamez Luciano Mata and Penaloza Agripina Cabrara
Current Estimated Value
Home Financials for this Owner
Home Financials are based on the most recent Mortgage that was taken out on this home.
Original Mortgage
$56,000
Outstanding Balance
$24,974
Interest Rate
3.8%
Mortgage Type
New Conventional
Estimated Equity
$139,385
Purchase Details
Closed on
Nov 21, 2006
Sold by
Stofford Joel and Stofford Minta
Bought by
Georgiou Bill N
Purchase Details
Closed on
Sep 21, 2006
Sold by
Norris Tony A and Patterson Isabel R
Bought by
Stofford Joel and Stofford Minta
Purchase Details
Closed on
Mar 1, 1994
Purchase Details
Closed on
Dec 1, 1984
Bought by
Norris Tony A and Davis Isabel R
Create a Home Valuation Report for This Property
The Home Valuation Report is an in-depth analysis detailing your home's value as well as a comparison with similar homes in the area
Home Values in the Area
Average Home Value in this Area
Purchase History
| Date | Buyer | Sale Price | Title Company |
|---|---|---|---|
| Yamez Luciano Mata | $56,000 | None Available | |
| Georgiou Bill N | $24,000 | None Available | |
| Stofford Joel | $20,000 | None Available | |
| -- | $11,000 | -- | |
| Norris Tony A | $24,500 | -- |
Source: Public Records
Mortgage History
| Date | Status | Borrower | Loan Amount |
|---|---|---|---|
| Open | Yamez Luciano Mata | $56,000 |
Source: Public Records
Tax History Compared to Growth
Tax History
| Year | Tax Paid | Tax Assessment Tax Assessment Total Assessment is a certain percentage of the fair market value that is determined by local assessors to be the total taxable value of land and additions on the property. | Land | Improvement |
|---|---|---|---|---|
| 2025 | $1,396 | $122,950 | $50,000 | $72,950 |
| 2024 | $1,396 | $122,950 | $50,000 | $72,950 |
| 2023 | $955 | $69,680 | $26,000 | $43,680 |
| 2022 | $955 | $69,680 | $26,000 | $43,680 |
| 2021 | $955 | $69,680 | $26,000 | $43,680 |
| 2020 | $955 | $69,680 | $26,000 | $43,680 |
| 2019 | $584 | $42,650 | $6,750 | $35,900 |
| 2018 | $576 | $42,650 | $6,750 | $35,900 |
| 2017 | $567 | $42,650 | $6,750 | $35,900 |
| 2016 | $567 | $54,830 | $11,250 | $43,580 |
| 2015 | -- | $54,830 | $11,250 | $43,580 |
| 2014 | -- | $54,830 | $11,250 | $43,580 |
Source: Public Records
Map
Nearby Homes
- 818 Skyland St
- 1022 Lakeview St
- 1218 Martin Luther King Junior Ave
- 910 Fairview St
- 132 Kennedy Ave
- 704 Gem St Unit 17
- 704 S Harding Ave
- 1422 Mitchell Glen St
- 209 James St
- 621 Norland Ave
- 108 S Little Texas Rd
- 617 Fairview St
- 615 Fairview St
- 1052 Mclain Rd
- 1050 Mclain Rd
- 302 Melinda Ave
- 803 Irene Ave
- 613 Hillside St
- 608 Fairview St
- 141 Beaumont Ave