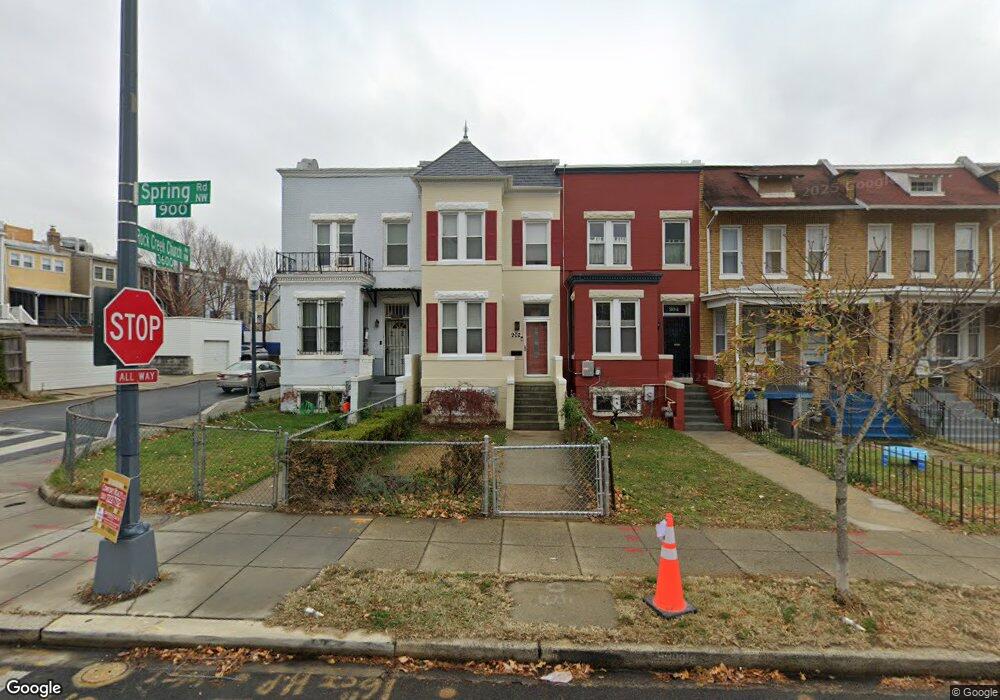
902 Spring Rd NW Washington, DC 20010
Columbia Heights NeighborhoodEstimated Value: $744,000 - $847,000
3
Beds
2
Baths
1,616
Sq Ft
$493/Sq Ft
Est. Value
About This Home
This home is located at 902 Spring Rd NW, Washington, DC 20010 and is currently estimated at $796,253, approximately $492 per square foot. 902 Spring Rd NW is a home located in District of Columbia with nearby schools including Raymond Education Campus, MacFarland Middle School, and Roosevelt High School @ MacFarland.
Ownership History
Date
Name
Owned For
Owner Type
Purchase Details
Closed on
Dec 13, 2024
Sold by
Aviles Anaelsa
Bought by
Aviles Anaelsa and Parish Vandolf
Current Estimated Value
Purchase Details
Closed on
Oct 6, 2004
Sold by
Spiegel Ann H
Bought by
Aviles Anaelsa
Home Financials for this Owner
Home Financials are based on the most recent Mortgage that was taken out on this home.
Original Mortgage
$320,000
Interest Rate
5.84%
Mortgage Type
New Conventional
Purchase Details
Closed on
Oct 28, 2003
Sold by
George Magdalene
Bought by
Spiegel Ann H
Purchase Details
Closed on
Jul 31, 2000
Sold by
Johnson Ladd W
Bought by
George Magdelene
Home Financials for this Owner
Home Financials are based on the most recent Mortgage that was taken out on this home.
Original Mortgage
$115,200
Interest Rate
8.1%
Create a Home Valuation Report for This Property
The Home Valuation Report is an in-depth analysis detailing your home's value as well as a comparison with similar homes in the area
Home Values in the Area
Average Home Value in this Area
Purchase History
| Date | Buyer | Sale Price | Title Company |
|---|---|---|---|
| Aviles Anaelsa | -- | None Listed On Document | |
| Aviles Anaelsa | -- | None Listed On Document | |
| Aviles Anaelsa | $400,000 | -- | |
| Spiegel Ann H | $180,000 | -- | |
| George Magdelene | $128,000 | -- |
Source: Public Records
Mortgage History
| Date | Status | Borrower | Loan Amount |
|---|---|---|---|
| Previous Owner | Aviles Anaelsa | $320,000 | |
| Previous Owner | George Magdelene | $115,200 |
Source: Public Records
Tax History
| Year | Tax Paid | Tax Assessment Tax Assessment Total Assessment is a certain percentage of the fair market value that is determined by local assessors to be the total taxable value of land and additions on the property. | Land | Improvement |
|---|---|---|---|---|
| 2025 | $6,386 | $841,150 | $497,510 | $343,640 |
| 2024 | $6,328 | $831,470 | $492,520 | $338,950 |
| 2023 | $6,273 | $821,950 | $488,720 | $333,230 |
| 2022 | $6,522 | $767,340 | $462,190 | $305,150 |
| 2021 | $6,374 | $749,880 | $455,360 | $294,520 |
| 2020 | $5,409 | $726,160 | $451,420 | $274,740 |
| 2019 | $4,924 | $709,690 | $428,270 | $281,420 |
| 2017 | $4,087 | $648,130 | $0 | $0 |
| 2016 | $3,721 | $576,850 | $0 | $0 |
Source: Public Records
Map
Nearby Homes
- 3644 New Hampshire Ave NW
- 3656 New Hampshire Ave NW Unit 4
- 3656 New Hampshire Ave NW Unit 3
- 3534 10th St NW Unit 200
- 747 Newton Place NW
- 739 Newton Place NW Unit 104
- 825 Rock Creek Church Rd NW
- 3619 Georgia Ave NW Unit 603
- 3619 Georgia Ave NW Unit 405
- 1213 Otis Place NW
- 770 Park Rd NW Unit 203
- 764 Park Rd NW
- 1017 Monroe St NW Unit 2
- 1011 Quebec Place NW
- 3524 11th St NW
- 745 Princeton Place NW
- 1020 Monroe St NW Unit 204
- 1000 Park Rd NW
- 707 Otis Place NW
- 615 Newton Place NW
- 904 Spring Rd NW
- 900 Spring Rd NW
- 906 Spring Rd NW
- 908 Spring Rd NW
- 3624 Rock Creek Church Rd NW
- 910 Spring Rd NW
- 3622 Rock Creek Church Rd NW Unit 2
- 3622 Rock Creek Church Rd NW Unit 1
- 3622 Rock Creek Church Rd NW
- 912 Spring Rd NW
- 3620 Rock Creek Church Rd NW
- 914 Spring Rd NW
- 3626 New Hampshire Ave NW
- 3618 Rock Ck Ch Rd NW Unit B
- 3624 New Hampshire Ave NW
- 3606 Rock Creek Church Rd NW Unit 2
- 3606 Rock Creek Church Rd NW Unit 4
- 3606 Rock Creek Church Rd NW
- 3606 Rock Creek Church Rd NW Unit 101
- 3606 Rock Creek Church Rd NW Unit 103
Your Personal Tour Guide
Ask me questions while you tour the home.