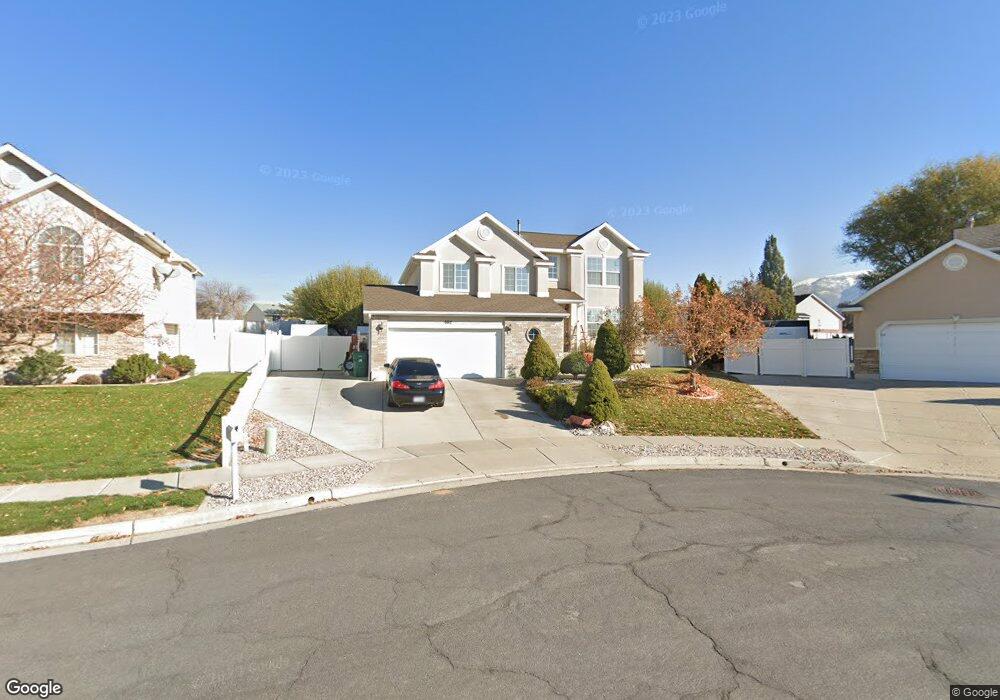
902 W 2275 N Layton, UT 84041
Estimated Value: $515,197 - $602,000
4
Beds
3
Baths
2,329
Sq Ft
$235/Sq Ft
Est. Value
About This Home
This home is located at 902 W 2275 N, Layton, UT 84041 and is currently estimated at $548,049, approximately $235 per square foot. 902 W 2275 N is a home located in Davis County with nearby schools including Lincoln Elementary School, North Layton Junior High School, and Northridge High School.
Ownership History
Date
Name
Owned For
Owner Type
Purchase Details
Closed on
Nov 21, 2005
Sold by
Mayoral Eduardo and Mayopal Eduardo
Bought by
Mayoral Eduardo
Current Estimated Value
Home Financials for this Owner
Home Financials are based on the most recent Mortgage that was taken out on this home.
Original Mortgage
$52,000
Interest Rate
5.58%
Mortgage Type
New Conventional
Purchase Details
Closed on
Jan 12, 2004
Sold by
Delamare Timothy A
Bought by
Mayoral Eduardo
Home Financials for this Owner
Home Financials are based on the most recent Mortgage that was taken out on this home.
Original Mortgage
$148,000
Outstanding Balance
$63,714
Interest Rate
4.87%
Mortgage Type
Purchase Money Mortgage
Estimated Equity
$484,335
Purchase Details
Closed on
Dec 27, 1999
Sold by
Gmw Development Inc
Bought by
Delamare Timothy A
Home Financials for this Owner
Home Financials are based on the most recent Mortgage that was taken out on this home.
Original Mortgage
$180,300
Interest Rate
7.69%
Create a Home Valuation Report for This Property
The Home Valuation Report is an in-depth analysis detailing your home's value as well as a comparison with similar homes in the area
Home Values in the Area
Average Home Value in this Area
Purchase History
| Date | Buyer | Sale Price | Title Company |
|---|---|---|---|
| Mayoral Eduardo | -- | First American Title | |
| Mayoral Eduardo | -- | Backman Stewart Title Svcs | |
| Delamare Timothy A | -- | Bonneville Title Company Inc |
Source: Public Records
Mortgage History
| Date | Status | Borrower | Loan Amount |
|---|---|---|---|
| Closed | Mayoral Eduardo | $52,000 | |
| Open | Mayoral Eduardo | $148,000 | |
| Previous Owner | Delamare Timothy A | $180,300 | |
| Closed | Mayoral Eduardo | $37,000 |
Source: Public Records
Tax History
| Year | Tax Paid | Tax Assessment Tax Assessment Total Assessment is a certain percentage of the fair market value that is determined by local assessors to be the total taxable value of land and additions on the property. | Land | Improvement |
|---|---|---|---|---|
| 2025 | $2,489 | $261,250 | $100,178 | $161,072 |
| 2024 | $2,372 | $250,801 | $116,837 | $133,964 |
| 2023 | $2,457 | $458,000 | $139,920 | $318,080 |
| 2022 | $2,527 | $255,750 | $73,674 | $182,076 |
| 2021 | $2,312 | $349,000 | $102,544 | $246,456 |
| 2020 | $2,099 | $304,000 | $86,619 | $217,381 |
| 2019 | $2,023 | $287,000 | $82,576 | $204,424 |
| 2018 | $1,987 | $283,000 | $82,576 | $200,424 |
| 2016 | $1,755 | $128,921 | $26,164 | $102,757 |
| 2015 | $1,793 | $125,016 | $26,164 | $98,852 |
| 2014 | $1,859 | $132,579 | $26,164 | $106,415 |
| 2013 | -- | $119,182 | $26,884 | $92,298 |
Source: Public Records
Map
Nearby Homes
- 820 W 2350 N
- 2386 N 800 W
- 2320 N 1085 W
- 1012 W 2525 N
- 2236 N 525 W
- 506 W 2200 N
- 498 W 2200 N
- 2246 N 475 W
- 2214 N 450 W
- 2893 N 1150 W
- 2875 N Hill Field Rd Unit 17
- 2875 N Hill Field Rd Unit 199
- 2875 N Hill Field Rd Unit 29
- 2896 N 1175 W
- 2931 N 1175 W
- 709 W Highway 193
- 1094 N Angel St W
- 1498 W 1850 N
- 1619 N Angel St W
- 1621 N Angel St W
Your Personal Tour Guide
Ask me questions while you tour the home.