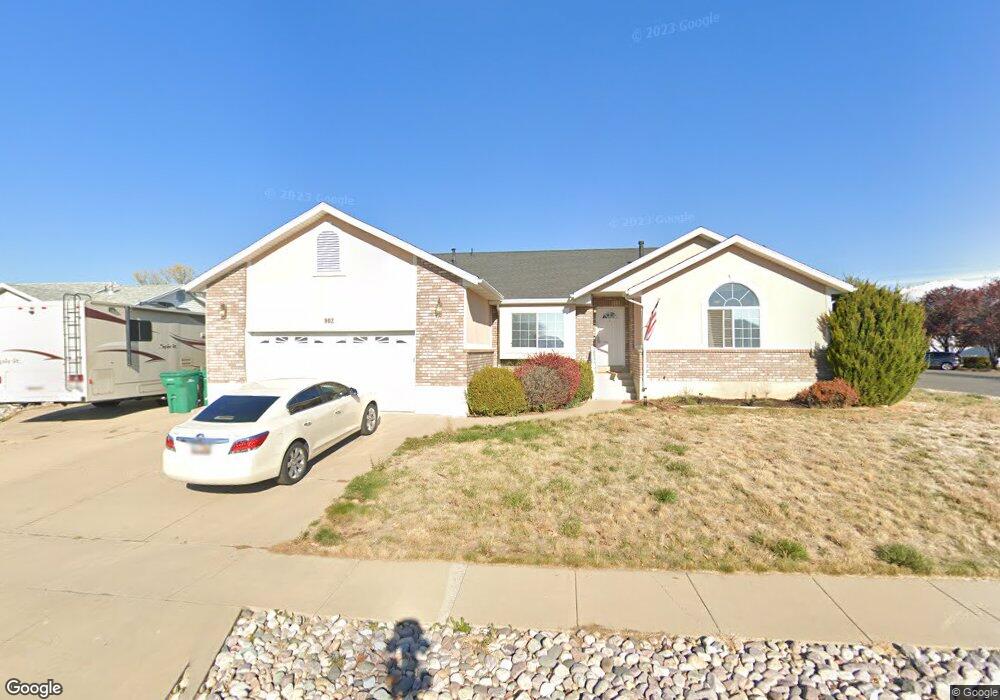
902 W 2350 N Layton, UT 84041
Estimated Value: $519,000 - $570,000
5
Beds
3
Baths
3,000
Sq Ft
$184/Sq Ft
Est. Value
About This Home
This home is located at 902 W 2350 N, Layton, UT 84041 and is currently estimated at $550,776, approximately $183 per square foot. 902 W 2350 N is a home located in Davis County with nearby schools including Lincoln Elementary School, North Layton Junior High School, and Northridge High School.
Ownership History
Date
Name
Owned For
Owner Type
Purchase Details
Closed on
Jul 11, 2019
Sold by
Mathis Gary A and Mathis Terrie K
Bought by
Crisswell Randall Jeffrey and Crisswell Shannon
Current Estimated Value
Home Financials for this Owner
Home Financials are based on the most recent Mortgage that was taken out on this home.
Original Mortgage
$351,500
Outstanding Balance
$307,795
Interest Rate
3.9%
Mortgage Type
New Conventional
Estimated Equity
$242,981
Purchase Details
Closed on
Jul 26, 2012
Sold by
Mathis Gary A and Mathis Terrie Kay
Bought by
Mathis Gary A and Mathis Terrie K
Purchase Details
Closed on
Jan 31, 1996
Sold by
H K Stephenson Construction Co Inc
Bought by
Mathis Gary A and Mathis Terrie Kay
Home Financials for this Owner
Home Financials are based on the most recent Mortgage that was taken out on this home.
Original Mortgage
$100,000
Interest Rate
7.25%
Create a Home Valuation Report for This Property
The Home Valuation Report is an in-depth analysis detailing your home's value as well as a comparison with similar homes in the area
Home Values in the Area
Average Home Value in this Area
Purchase History
| Date | Buyer | Sale Price | Title Company |
|---|---|---|---|
| Crisswell Randall Jeffrey | -- | Mountain View Title | |
| Mathis Gary A | -- | None Available | |
| Mathis Gary A | -- | Bonneville Title Company Inc |
Source: Public Records
Mortgage History
| Date | Status | Borrower | Loan Amount |
|---|---|---|---|
| Open | Crisswell Randall Jeffrey | $351,500 | |
| Previous Owner | Mathis Gary A | $100,000 |
Source: Public Records
Tax History Compared to Growth
Tax History
| Year | Tax Paid | Tax Assessment Tax Assessment Total Assessment is a certain percentage of the fair market value that is determined by local assessors to be the total taxable value of land and additions on the property. | Land | Improvement |
|---|---|---|---|---|
| 2025 | $2,615 | $274,450 | $101,966 | $172,484 |
| 2024 | $2,497 | $264,000 | $118,500 | $145,500 |
| 2023 | $2,495 | $465,000 | $138,030 | $326,970 |
| 2022 | $2,619 | $265,100 | $73,825 | $191,275 |
| 2021 | $2,445 | $369,000 | $105,832 | $263,168 |
| 2020 | $2,230 | $323,000 | $88,088 | $234,912 |
| 2019 | $2,164 | $307,000 | $82,795 | $224,205 |
| 2018 | $1,959 | $279,000 | $82,795 | $196,205 |
| 2016 | $1,865 | $137,005 | $27,073 | $109,932 |
| 2015 | $1,765 | $123,090 | $27,073 | $96,017 |
| 2014 | $1,756 | $125,236 | $27,073 | $98,163 |
| 2013 | -- | $119,731 | $26,884 | $92,847 |
Source: Public Records
Map
Nearby Homes
- 2298 N 1085 W
- 2149 N 750 W
- 1155 W 2200 N
- 2211 N 525 W
- 2248 N 500 W
- 506 W 2200 N
- 2233 N 475 W
- 2875 N Hill Field Rd Unit 17
- 2875 N Hill Field Rd Unit 199
- 2875 N Hill Field Rd Unit 58
- 2875 N Hill Field Rd Unit 62
- 2875 N Hill Field Rd Unit 40
- 2887 N 1175 W
- 709 W Highway 193
- 538 W 1875 N
- 2949 N 1175 W
- 61 Sunset Dr
- 1070 S 1650 E
- 2600 N Hill Field Rd Unit 108
- 2600 N Hill Field Rd Unit 4