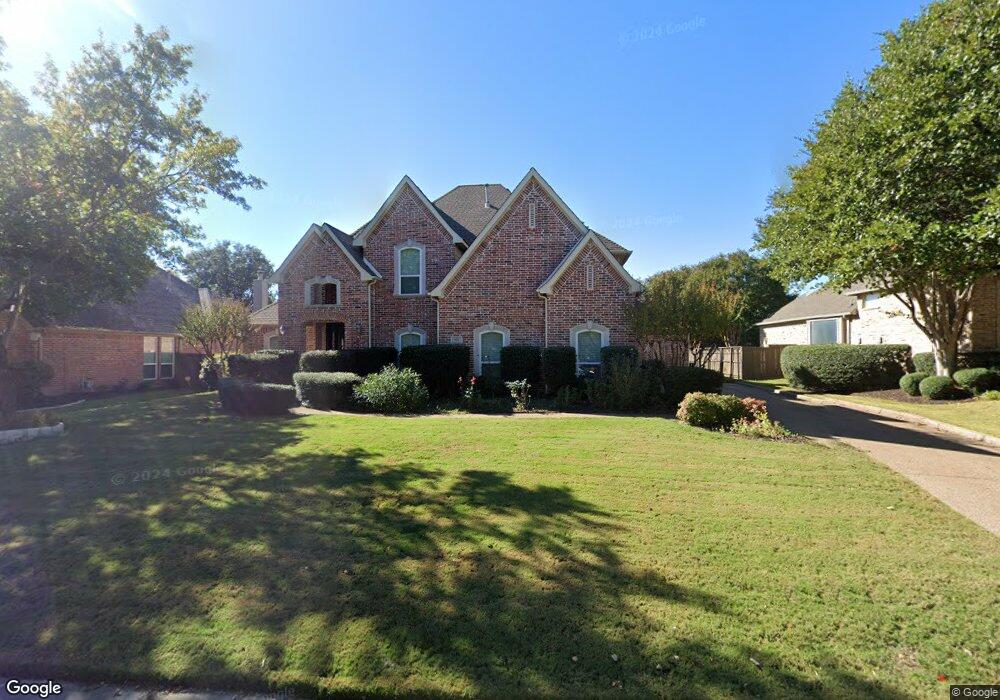
902 Wentwood Dr Southlake, TX 76092
Estimated Value: $1,140,000 - $1,264,000
5
Beds
4
Baths
3,749
Sq Ft
$315/Sq Ft
Est. Value
About This Home
This home is located at 902 Wentwood Dr, Southlake, TX 76092 and is currently estimated at $1,180,856, approximately $314 per square foot. 902 Wentwood Dr is a home located in Tarrant County with nearby schools including Robert High Rockenbaugh Elementary School, Eubanks Intermediate School, and George Dawson Middle School.
Ownership History
Date
Name
Owned For
Owner Type
Purchase Details
Closed on
Sep 5, 2017
Sold by
Moore Mark J and Moore Lisa M
Bought by
Sun Yannan and Stevens Andrew Jonathan
Current Estimated Value
Home Financials for this Owner
Home Financials are based on the most recent Mortgage that was taken out on this home.
Original Mortgage
$424,000
Outstanding Balance
$348,909
Interest Rate
3.37%
Mortgage Type
Adjustable Rate Mortgage/ARM
Estimated Equity
$831,947
Purchase Details
Closed on
Feb 17, 2000
Sold by
Pierce Homes Inc
Bought by
Moore Mark J and Moore Lisa M
Home Financials for this Owner
Home Financials are based on the most recent Mortgage that was taken out on this home.
Original Mortgage
$319,300
Interest Rate
8%
Create a Home Valuation Report for This Property
The Home Valuation Report is an in-depth analysis detailing your home's value as well as a comparison with similar homes in the area
Home Values in the Area
Average Home Value in this Area
Purchase History
| Date | Buyer | Sale Price | Title Company |
|---|---|---|---|
| Sun Yannan | -- | None Available | |
| Moore Mark J | -- | Ticor Land Title Co |
Source: Public Records
Mortgage History
| Date | Status | Borrower | Loan Amount |
|---|---|---|---|
| Open | Sun Yannan | $424,000 | |
| Previous Owner | Moore Mark J | $319,300 |
Source: Public Records
Tax History Compared to Growth
Tax History
| Year | Tax Paid | Tax Assessment Tax Assessment Total Assessment is a certain percentage of the fair market value that is determined by local assessors to be the total taxable value of land and additions on the property. | Land | Improvement |
|---|---|---|---|---|
| 2025 | $12,016 | $963,000 | $225,000 | $738,000 |
| 2024 | $12,016 | $1,006,007 | $225,000 | $781,007 |
| 2023 | $13,333 | $1,230,961 | $225,000 | $1,005,961 |
| 2022 | $14,347 | $665,000 | $175,000 | $490,000 |
| 2021 | $15,162 | $665,000 | $175,000 | $490,000 |
| 2020 | $15,197 | $661,121 | $175,000 | $486,121 |
| 2019 | $16,009 | $661,121 | $175,000 | $486,121 |
| 2018 | $15,229 | $667,799 | $130,000 | $537,799 |
| 2017 | $15,179 | $612,391 | $130,000 | $482,391 |
| 2016 | $14,921 | $602,003 | $130,000 | $472,003 |
| 2015 | $13,469 | $623,644 | $100,000 | $523,644 |
| 2014 | $13,469 | $557,800 | $60,000 | $497,800 |
Source: Public Records
Map
Nearby Homes
- 710 Longford Dr
- 708 Nettleton Dr
- 712 Ashleigh Ln
- 1100 La Paloma Ct
- 1227 Strathmore Dr
- 1012 Cool River Dr
- 608 Regency Crossing
- 1420 Kensington Ct
- 221 Pine Dr
- 521 Regency Crossing
- 351 S White Chapel Blvd
- 1401 Chardonnay Ct
- 802 Princeton Ct
- 305 Canyon Lake Dr
- 1032 Rosavine Dr
- 1028 Rosavine Dr
- 1017 Rosavine Dr
- 1004 Rosavine Dr
- 1020 Rosavine Dr
- 1012 Rosavine Dr
- 900 Wentwood Dr
- 904 Wentwood Dr
- 608 Rustic Ridge Ct
- 906 Wentwood Dr
- 810 Wentwood Dr
- 905 Wentwood Dr
- 607 Rustic Ridge Ct
- 903 Wentwood Dr
- 907 Wentwood Dr
- 901 Aaron Way
- 901 Wentwood Dr
- 900 Aaron Way
- 606 Rustic Ridge Ct
- 908 Wentwood Dr
- 909 Wentwood Dr
- 903 Aaron Way
- 808 Wentwood Dr
- 813 Wentwood Dr
- 605 Rustic Ridge Ct
- 910 Wentwood Dr