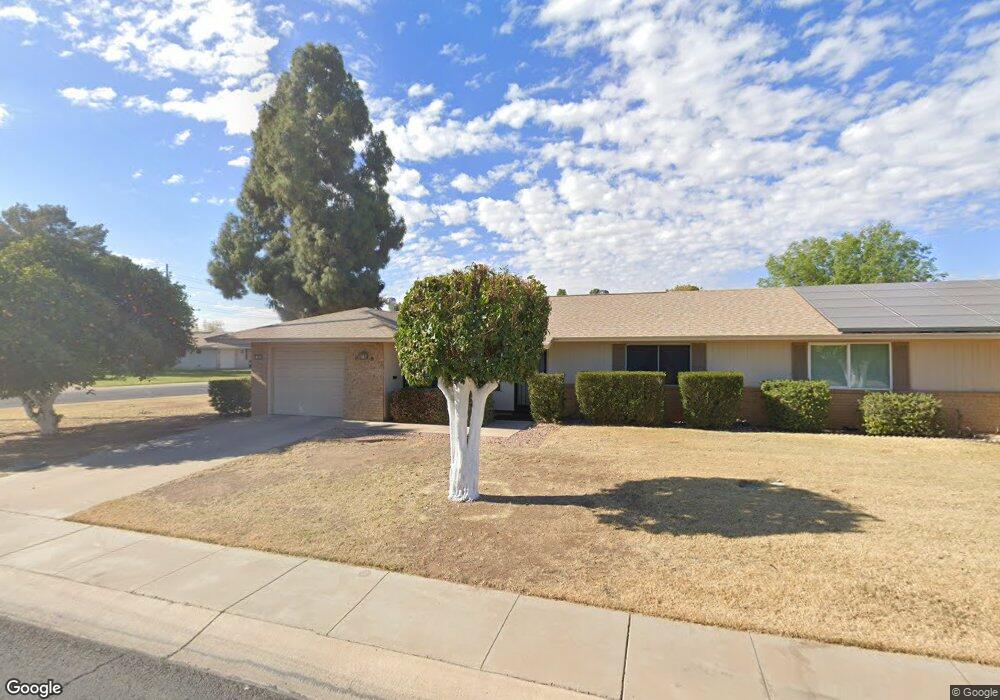
9020 N 109th Ave Sun City, AZ 85351
Estimated Value: $177,414 - $202,000
2
Beds
1
Bath
1,046
Sq Ft
$183/Sq Ft
Est. Value
About This Home
This home is located at 9020 N 109th Ave, Sun City, AZ 85351 and is currently estimated at $191,604, approximately $183 per square foot. 9020 N 109th Ave is a home located in Maricopa County with nearby schools including Desert Mirage Elementary School, Ombudsman - Northwest Charter, and Peoria Accelerated High School.
Ownership History
Date
Name
Owned For
Owner Type
Purchase Details
Closed on
Oct 20, 2016
Sold by
Vanness Susanne
Bought by
Vanness Susanne M
Current Estimated Value
Purchase Details
Closed on
Mar 23, 2010
Sold by
Kalton William
Bought by
Vanness Susanne
Home Financials for this Owner
Home Financials are based on the most recent Mortgage that was taken out on this home.
Original Mortgage
$60,877
Interest Rate
5.37%
Mortgage Type
FHA
Purchase Details
Closed on
Mar 18, 2005
Sold by
Kalton William
Bought by
Kalton William
Purchase Details
Closed on
Dec 3, 2004
Sold by
Estate Of Antoinette Kalton
Bought by
Kalton William
Purchase Details
Closed on
Jan 26, 2004
Sold by
Kalton William
Bought by
Vanness Susanne
Home Financials for this Owner
Home Financials are based on the most recent Mortgage that was taken out on this home.
Original Mortgage
$60,877
Interest Rate
4.38%
Mortgage Type
FHA
Create a Home Valuation Report for This Property
The Home Valuation Report is an in-depth analysis detailing your home's value as well as a comparison with similar homes in the area
Home Values in the Area
Average Home Value in this Area
Purchase History
| Date | Buyer | Sale Price | Title Company |
|---|---|---|---|
| Vanness Susanne M | -- | None Available | |
| Vanness Susanne | $62,000 | Empire West Title Agency | |
| Kalton William | -- | -- | |
| Kalton William | -- | -- | |
| Vanness Susanne | $62,000 | Empire West Title Agency |
Source: Public Records
Mortgage History
| Date | Status | Borrower | Loan Amount |
|---|---|---|---|
| Previous Owner | Vanness Susanne | $60,877 | |
| Previous Owner | Vanness Susanne | $60,877 |
Source: Public Records
Tax History Compared to Growth
Tax History
| Year | Tax Paid | Tax Assessment Tax Assessment Total Assessment is a certain percentage of the fair market value that is determined by local assessors to be the total taxable value of land and additions on the property. | Land | Improvement |
|---|---|---|---|---|
| 2025 | $670 | $7,474 | -- | -- |
| 2024 | $612 | $7,118 | -- | -- |
| 2023 | $612 | $14,160 | $2,830 | $11,330 |
| 2022 | $574 | $12,580 | $2,510 | $10,070 |
| 2021 | $586 | $11,310 | $2,260 | $9,050 |
| 2020 | $573 | $9,810 | $1,960 | $7,850 |
| 2019 | $565 | $8,800 | $1,760 | $7,040 |
| 2018 | $547 | $7,480 | $1,490 | $5,990 |
| 2017 | $530 | $6,730 | $1,340 | $5,390 |
| 2016 | $296 | $5,760 | $1,150 | $4,610 |
| 2015 | $471 | $5,200 | $1,040 | $4,160 |
Source: Public Records
Map
Nearby Homes
- 10825 W Caron Dr
- 10726 W Kelso Dr Unit 172
- 10731 W Mission Ln Unit 200
- 10707 W Mission Ln
- 10732 W Denham Dr Unit 17
- 9202 N 107th Ave Unit 8
- 10726 W Denham Dr Unit 16
- 11005 W Kelso Dr
- 9415 N 111th Ave
- 8800 N 107th Ave Unit 17
- 8800 N 107th Ave Unit 19
- 8800 N 107th Ave Unit 52
- 9459 N 111th Ave
- 10816 W Venturi Dr
- 9614 N 110th Ave
- 10801 W Mountain View Rd
- 10788 W Cinnebar Ave
- 11138 W Hatcher Rd
- 8582 N 107th Ln
- 8566 N 108th Ln
- 9024 N 109th Ave
- 10914 W Caron Dr
- 9030 N 109th Ave
- 9013 N 109th Ave
- 9019 N 109th Ave Unit 144
- 10905 W Caron Dr
- 10918 W Caron Dr
- 9025 N 109th Ave
- 9034 N 109th Ave Unit 9
- 10901 W Caron Dr
- 9029 N 109th Ave
- 10915 W Kelso Dr Unit 6G
- 10855 W Caron Dr
- 10917 W Caron Dr
- 10924 W Caron Dr
- 10919 W Kelso Dr
- 10849 W Caron Dr
- 10921 W Caron Dr Unit 9
- 10839 W Kelso Dr Unit 9
- 10925 W Caron Dr