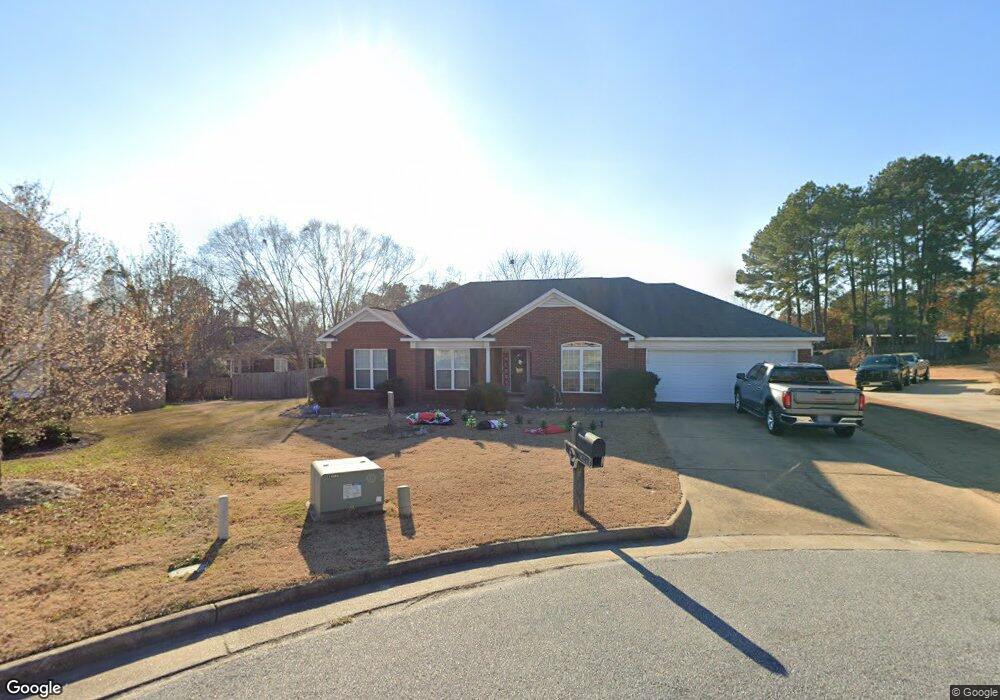
9021 Orchard Valley Ln Midland, GA 31820
Midland NeighborhoodEstimated Value: $333,000 - $378,000
4
Beds
2
Baths
2,136
Sq Ft
$165/Sq Ft
Est. Value
About This Home
This home is located at 9021 Orchard Valley Ln, Midland, GA 31820 and is currently estimated at $352,405, approximately $164 per square foot. 9021 Orchard Valley Ln is a home located in Muscogee County with nearby schools including Mathews Elementary School, Aaron Cohn Middle School, and Shaw High School.
Ownership History
Date
Name
Owned For
Owner Type
Purchase Details
Closed on
Nov 14, 2020
Sold by
Grella Mike
Bought by
Molina Luis D
Current Estimated Value
Purchase Details
Closed on
Jul 6, 2018
Sold by
Grella Mike
Bought by
Grella Mike and Grella Ashley
Home Financials for this Owner
Home Financials are based on the most recent Mortgage that was taken out on this home.
Original Mortgage
$226,227
Interest Rate
4.5%
Mortgage Type
VA
Purchase Details
Closed on
Jul 31, 2009
Sold by
Mack Jonathan Lowell
Bought by
Mack Jonathan Lowell and Mack Brooke Johnson
Home Financials for this Owner
Home Financials are based on the most recent Mortgage that was taken out on this home.
Original Mortgage
$210,044
Interest Rate
5.36%
Mortgage Type
FHA
Create a Home Valuation Report for This Property
The Home Valuation Report is an in-depth analysis detailing your home's value as well as a comparison with similar homes in the area
Home Values in the Area
Average Home Value in this Area
Purchase History
| Date | Buyer | Sale Price | Title Company |
|---|---|---|---|
| Molina Luis D | $242,000 | -- | |
| Grella Mike | -- | -- | |
| Grella Mike | $219,000 | -- | |
| Mack Jonathan Lowell | -- | None Available | |
| Mack Jonathan Lowell | $214,000 | None Available |
Source: Public Records
Mortgage History
| Date | Status | Borrower | Loan Amount |
|---|---|---|---|
| Previous Owner | Grella Mike | $226,227 | |
| Previous Owner | Mack Jonathan Lowell | $210,044 |
Source: Public Records
Tax History Compared to Growth
Tax History
| Year | Tax Paid | Tax Assessment Tax Assessment Total Assessment is a certain percentage of the fair market value that is determined by local assessors to be the total taxable value of land and additions on the property. | Land | Improvement |
|---|---|---|---|---|
| 2025 | $2,886 | $124,680 | $24,596 | $100,084 |
| 2024 | $2,885 | $124,680 | $24,596 | $100,084 |
| 2023 | $232 | $124,680 | $24,596 | $100,084 |
| 2022 | $2,507 | $100,144 | $18,596 | $81,548 |
| 2021 | $3,374 | $96,800 | $18,120 | $78,680 |
| 2020 | $2,889 | $82,872 | $18,596 | $64,276 |
| 2019 | $2,900 | $82,872 | $18,596 | $64,276 |
| 2018 | $2,505 | $82,872 | $18,596 | $64,276 |
| 2017 | $2,516 | $82,872 | $18,596 | $64,276 |
| 2016 | $2,528 | $84,901 | $14,000 | $70,901 |
| 2015 | $2,532 | $84,901 | $14,000 | $70,901 |
| 2014 | $2,536 | $84,901 | $14,000 | $70,901 |
| 2013 | -- | $84,901 | $14,000 | $70,901 |
Source: Public Records
Map
Nearby Homes
- 7988 Westlake Dr
- 8973 Orchard Valley Ln
- 7300 Pine Chase Dr
- 8016 Glen Valley Dr
- 7337 Pine Tar Dr
- 7365 Pine Tar Dr
- 7312 Pine Chase Dr
- 7343 Pine Chase Dr
- 7346 Pine Chase Dr
- 7359 Pine Tar Dr
- 7381 Pine Tar Dr
- 7333 Pine Chase Dr
- 7390 Pine Tar Dr
- 7382 Pine Tar Dr
- 70 Meadow Valley Ct
- 9759 Pine Seed Ct
- 7156 Tall Pine Ct
- 7133 Tall Pine Ct
- 9620 Hollow Pine Dr
- 7107 Pine Seed Dr
- 9017 Orchard Valley Ln
- 9025 Orchard Valley Ln
- 9151 Garrett Lake Dr
- 9149 Garrett Lake Dr
- 9153 Garrett Lake Dr
- 9155 Garrett Lake Dr
- 9011 Orchard Valley Ln
- 9020 Orchard Valley Ln
- 9147 Garrett Lake Dr
- 9157 Garrett Lake Dr
- 9145 Garrett Lake Dr
- 9016 Orchard Valley Ln
- 9143 Garrett Lake Dr
- 9009 Orchard Valley Ln
- 9159 Garrett Lake Dr
- 9004 Eastlake Dr
- 9012 Orchard Valley Ln
- 9008 Eastlake Dr
- 9144 Garrett Lake Dr
- 9142 Garrett Lake Dr