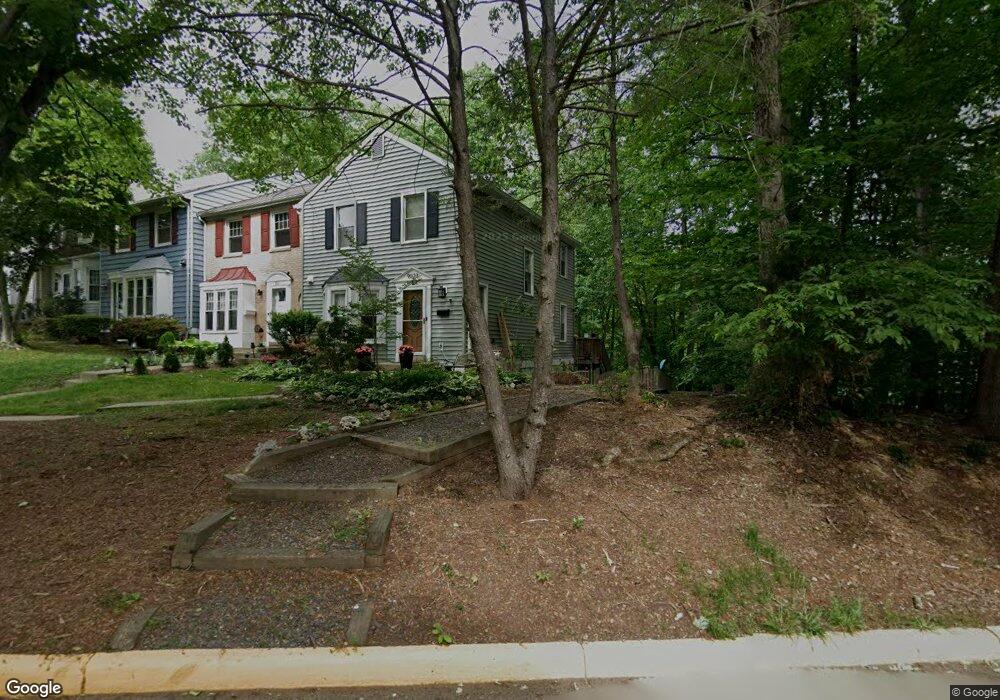
9023 Giltinan Ct Springfield, VA 22153
Estimated Value: $620,746 - $652,000
4
Beds
4
Baths
1,370
Sq Ft
$463/Sq Ft
Est. Value
About This Home
This home is located at 9023 Giltinan Ct, Springfield, VA 22153 and is currently estimated at $634,437, approximately $463 per square foot. 9023 Giltinan Ct is a home located in Fairfax County with nearby schools including Orange Hunt Elementary School, Irving Middle School, and West Springfield High School.
Ownership History
Date
Name
Owned For
Owner Type
Purchase Details
Closed on
Jul 22, 2003
Sold by
Haralson Jay
Bought by
Gloninger Christine S
Current Estimated Value
Home Financials for this Owner
Home Financials are based on the most recent Mortgage that was taken out on this home.
Original Mortgage
$218,400
Outstanding Balance
$93,412
Interest Rate
5.34%
Mortgage Type
New Conventional
Estimated Equity
$541,025
Purchase Details
Closed on
Jul 27, 2000
Sold by
Evetts Teri T
Bought by
Haralson Jay
Home Financials for this Owner
Home Financials are based on the most recent Mortgage that was taken out on this home.
Original Mortgage
$170,812
Interest Rate
8.18%
Purchase Details
Closed on
Mar 24, 1995
Sold by
Berrey Michael D
Bought by
Evetts Terri T
Home Financials for this Owner
Home Financials are based on the most recent Mortgage that was taken out on this home.
Original Mortgage
$134,950
Interest Rate
8.78%
Create a Home Valuation Report for This Property
The Home Valuation Report is an in-depth analysis detailing your home's value as well as a comparison with similar homes in the area
Home Values in the Area
Average Home Value in this Area
Purchase History
| Date | Buyer | Sale Price | Title Company |
|---|---|---|---|
| Gloninger Christine S | $273,000 | -- | |
| Haralson Jay | $170,900 | -- | |
| Evetts Terri T | $137,000 | -- |
Source: Public Records
Mortgage History
| Date | Status | Borrower | Loan Amount |
|---|---|---|---|
| Open | Evetts Terri T | $218,400 | |
| Previous Owner | Haralson Jay | $170,812 | |
| Previous Owner | Evetts Terri T | $134,950 |
Source: Public Records
Tax History Compared to Growth
Tax History
| Year | Tax Paid | Tax Assessment Tax Assessment Total Assessment is a certain percentage of the fair market value that is determined by local assessors to be the total taxable value of land and additions on the property. | Land | Improvement |
|---|---|---|---|---|
| 2025 | $6,412 | $582,980 | $216,000 | $366,980 |
| 2024 | $6,412 | $553,480 | $198,000 | $355,480 |
| 2023 | $5,759 | $510,350 | $180,000 | $330,350 |
| 2022 | $6,060 | $529,940 | $180,000 | $349,940 |
| 2021 | $5,315 | $452,950 | $126,000 | $326,950 |
| 2020 | $5,146 | $434,830 | $116,000 | $318,830 |
| 2019 | $4,841 | $409,020 | $116,000 | $293,020 |
| 2018 | $4,588 | $398,940 | $116,000 | $282,940 |
| 2017 | $4,383 | $377,530 | $110,000 | $267,530 |
| 2016 | $4,321 | $373,020 | $110,000 | $263,020 |
| 2015 | $4,109 | $368,160 | $110,000 | $258,160 |
| 2014 | $3,949 | $354,640 | $104,000 | $250,640 |
Source: Public Records
Map
Nearby Homes
- 9032 Golden Leaf Ct
- 7310 Glendower Ct
- 8914 Gutman Ct
- 8840 Eagle Rock Ln
- 7406 Arundel Place
- 8926 Applecross Ln
- 9101 Rural Plains Place
- 8812 Skyron Place
- 8809 Shadowlake Way
- 7100 Hundsford Ln
- 6903 Spelman Dr
- 8710 Whitson Ct
- 7222 Willow Oak Place
- 9226 Northedge Dr
- 9303 Macswain Place
- 7753 Northedge Ct
- 7508 Irene Ct
- 8619 Lauren Dr
- 7411 Reservation Dr
- 9107 Joyce Phillip Ct
- 9021 Giltinan Ct
- 9019 Giltinan Ct
- 9017 Giltinan Ct
- 9015 Giltinan Ct
- 9013 Giltinan Ct
- 9011 Giltinan Ct
- 9035 Giltinan Ct
- 9033 Giltinan Ct
- 9031 Giltinan Ct
- 9029 Giltinan Ct
- 9027 Giltinan Ct
- 9037 Giltinan Ct
- 9025 Giltinan Ct
- 9009 Giltinan Ct
- 9039 Giltinan Ct
- 9020 Giltinan Ct
- 9041 Giltinan Ct
- 9018 Giltinan Ct
- 9007 Giltinan Ct
- 9016 Giltinan Ct