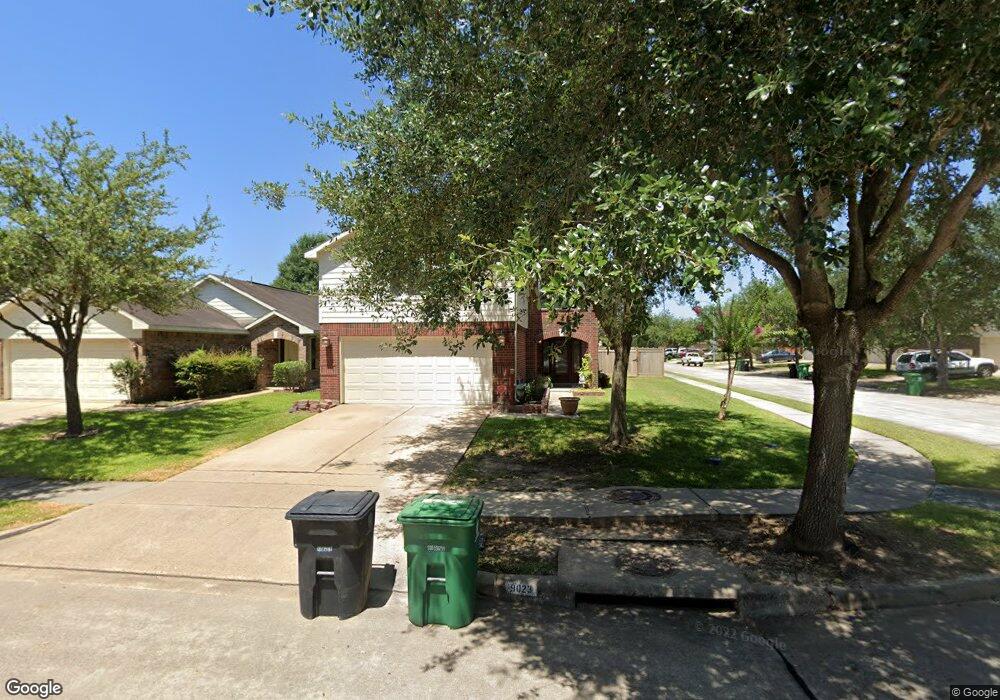
9023 Sporan Ln Houston, TX 77075
Southbelt-Ellington NeighborhoodEstimated Value: $286,000 - $302,000
4
Beds
3
Baths
2,330
Sq Ft
$126/Sq Ft
Est. Value
About This Home
This home is located at 9023 Sporan Ln, Houston, TX 77075 and is currently estimated at $294,327, approximately $126 per square foot. 9023 Sporan Ln is a home located in Harris County with nearby schools including Laura Welch Bush Elementary School, Morris Middle School, and Beverly Hill Intermediate School.
Ownership History
Date
Name
Owned For
Owner Type
Purchase Details
Closed on
Mar 26, 2007
Sold by
Beazer Homes Texas Lp
Bought by
Salazar Fidel and Castillo Lizette
Current Estimated Value
Home Financials for this Owner
Home Financials are based on the most recent Mortgage that was taken out on this home.
Original Mortgage
$154,558
Outstanding Balance
$93,756
Interest Rate
6.3%
Mortgage Type
Purchase Money Mortgage
Estimated Equity
$200,571
Create a Home Valuation Report for This Property
The Home Valuation Report is an in-depth analysis detailing your home's value as well as a comparison with similar homes in the area
Home Values in the Area
Average Home Value in this Area
Purchase History
| Date | Buyer | Sale Price | Title Company |
|---|---|---|---|
| Salazar Fidel | -- | Texas Lone Star Title Lp |
Source: Public Records
Mortgage History
| Date | Status | Borrower | Loan Amount |
|---|---|---|---|
| Open | Salazar Fidel | $154,558 |
Source: Public Records
Tax History Compared to Growth
Tax History
| Year | Tax Paid | Tax Assessment Tax Assessment Total Assessment is a certain percentage of the fair market value that is determined by local assessors to be the total taxable value of land and additions on the property. | Land | Improvement |
|---|---|---|---|---|
| 2025 | $6,405 | $300,000 | $41,633 | $258,367 |
| 2024 | $6,405 | $308,615 | $41,633 | $266,982 |
| 2023 | $6,405 | $303,449 | $41,633 | $261,816 |
| 2022 | $7,784 | $281,345 | $41,633 | $239,712 |
| 2021 | $7,464 | $232,781 | $36,735 | $196,046 |
| 2020 | $7,327 | $219,304 | $36,735 | $182,569 |
| 2019 | $7,144 | $212,505 | $31,837 | $180,668 |
| 2018 | $2,138 | $185,401 | $29,388 | $156,013 |
| 2017 | $6,274 | $185,401 | $29,388 | $156,013 |
| 2016 | $6,079 | $179,644 | $24,490 | $155,154 |
| 2015 | $4,773 | $166,753 | $24,490 | $142,263 |
| 2014 | $4,773 | $134,739 | $24,490 | $110,249 |
Source: Public Records
Map
Nearby Homes
- 8718 Black Cliff Ln
- 10806 Tallow Briar
- 001 Fuqua St
- 8626 Valley Crest Ln
- 8612 Fuqua St
- 8615 Tartan Walk Ln
- 10847 Nellsfield Ln
- 8420 Fuqua St
- 10858 Shannon Mills Ln
- 9307 Fuqua Ridge Ln
- 9130 Garden Breeze Dr
- 10506 Pleasant Villas Ln
- 11115 Opal Glen Ln
- 0 Fuqua St Unit 64883593
- 0 Fuqua St Unit 45902141
- 0 Fuqua St Unit 97219329
- 10934 Bradford Way Dr
- 8706 Danbury Hollow Ln
- 10518 Tenleyton Ln
- 10307 Collin Park