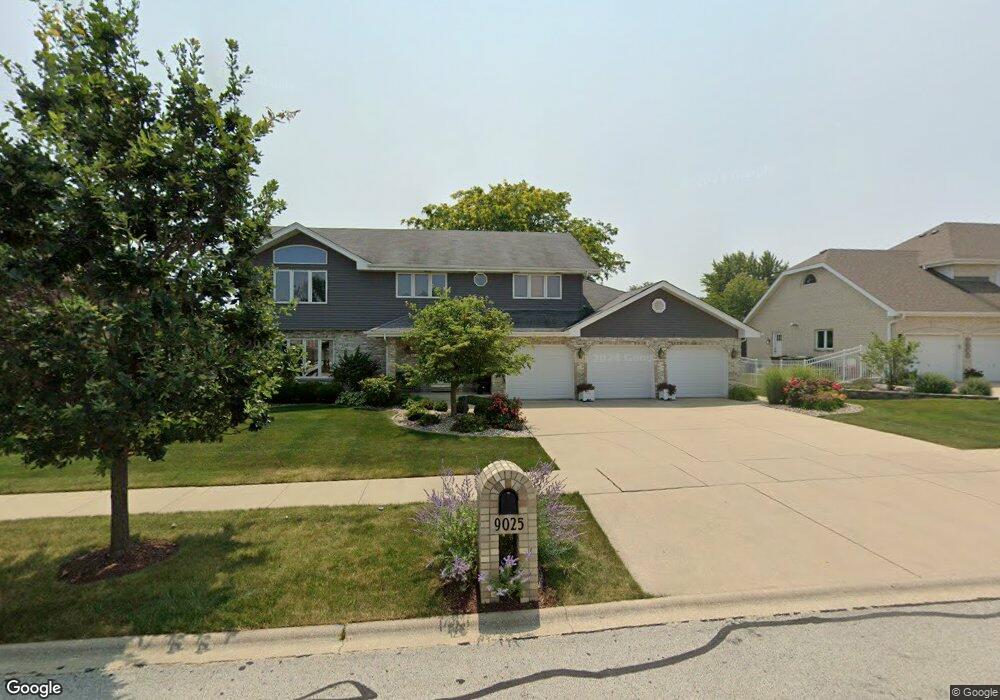
9025 Walnut Ln Tinley Park, IL 60487
Central Tinley Park NeighborhoodEstimated Value: $503,000 - $558,000
4
Beds
3
Baths
2,840
Sq Ft
$189/Sq Ft
Est. Value
About This Home
This home is located at 9025 Walnut Ln, Tinley Park, IL 60487 and is currently estimated at $536,579, approximately $188 per square foot. 9025 Walnut Ln is a home located in Cook County with nearby schools including Christa Mcauliffe School, Prairie View Middle School, and Victor J Andrew High School.
Ownership History
Date
Name
Owned For
Owner Type
Purchase Details
Closed on
Oct 8, 2021
Sold by
Hiskes John A and Hiskes Elaine J
Bought by
Hiskes John A and Hiskes Elaine J
Current Estimated Value
Purchase Details
Closed on
Nov 12, 1996
Sold by
Palomo John D and Palomo Juan D
Bought by
Hiskes John A and Hiskes Elaine J
Home Financials for this Owner
Home Financials are based on the most recent Mortgage that was taken out on this home.
Original Mortgage
$90,000
Interest Rate
7.94%
Create a Home Valuation Report for This Property
The Home Valuation Report is an in-depth analysis detailing your home's value as well as a comparison with similar homes in the area
Home Values in the Area
Average Home Value in this Area
Purchase History
| Date | Buyer | Sale Price | Title Company |
|---|---|---|---|
| Hiskes John A | -- | Attorney | |
| Hiskes John A | $285,000 | -- |
Source: Public Records
Mortgage History
| Date | Status | Borrower | Loan Amount |
|---|---|---|---|
| Closed | Hiskes John A | $90,000 |
Source: Public Records
Tax History Compared to Growth
Tax History
| Year | Tax Paid | Tax Assessment Tax Assessment Total Assessment is a certain percentage of the fair market value that is determined by local assessors to be the total taxable value of land and additions on the property. | Land | Improvement |
|---|---|---|---|---|
| 2024 | $10,328 | $43,165 | $16,639 | $26,526 |
| 2023 | $8,788 | $46,000 | $16,639 | $29,361 |
| 2022 | $8,788 | $30,808 | $7,178 | $23,630 |
| 2021 | $8,561 | $30,806 | $7,177 | $23,629 |
| 2020 | $8,476 | $30,806 | $7,177 | $23,629 |
| 2019 | $8,505 | $32,397 | $6,525 | $25,872 |
| 2018 | $8,319 | $32,397 | $6,525 | $25,872 |
| 2017 | $8,131 | $32,397 | $6,525 | $25,872 |
| 2016 | $9,515 | $32,929 | $5,872 | $27,057 |
| 2015 | $9,958 | $32,929 | $5,872 | $27,057 |
| 2014 | $9,890 | $32,929 | $5,872 | $27,057 |
| 2013 | $9,997 | $35,730 | $5,872 | $29,858 |
Source: Public Records
Map
Nearby Homes
- 17533 Pecan Ln
- 9201 175th St
- 9260 Windsor Pkwy Unit 80
- 9280 Windsor Pkwy Unit 92
- 17230 Shetland Dr
- 9334 Drummond Dr Unit 3
- 17224 Briar Dr
- 17631 Dover Ct
- Fremont Plan at Radcliffe Place
- Calysta Plan at Radcliffe Place
- Danbury Plan at Radcliffe Place
- Briarcliffe Plan at Radcliffe Place
- Eden Plan at Radcliffe Place
- Amberwood Plan at Radcliffe Place
- 17324 Humber Ln
- 9413 Caledonia Dr
- 17535 S La Grange Rd
- 17535-2 Lagrange Rd
- 17018 93rd Ave
- 17964 Upland Dr