Estimated Value: $369,000 - $455,000
3
Beds
2
Baths
1,503
Sq Ft
$264/Sq Ft
Est. Value
About This Home
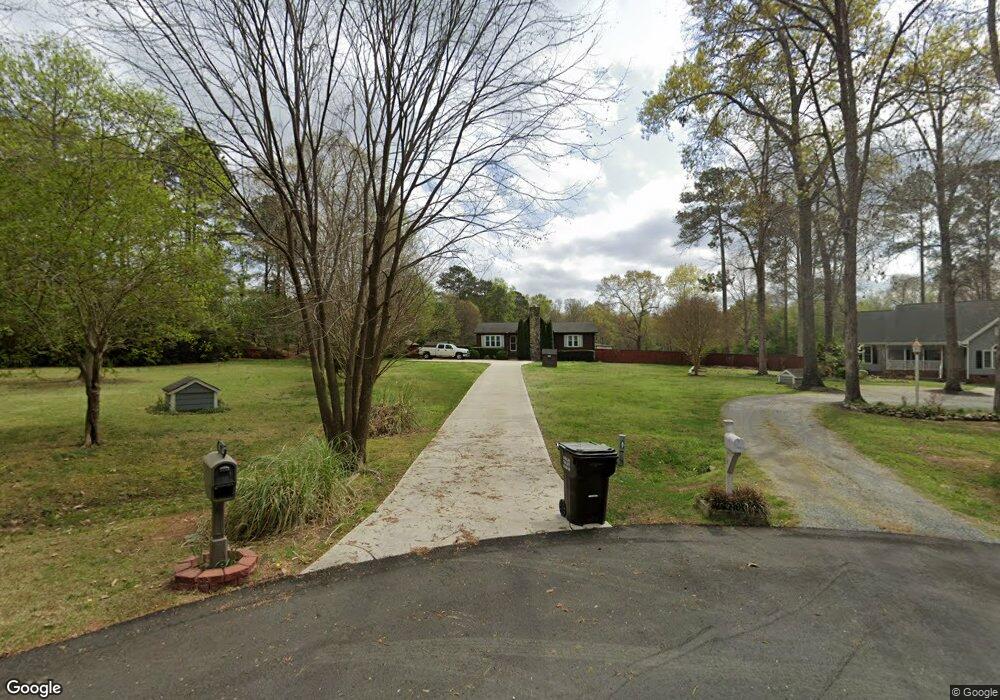
This home is located at 9025 Wesley Ct, Apex, NC 27539 and is currently estimated at $396,870, approximately $264 per square foot. 9025 Wesley Ct is a home located in Wake County with nearby schools including Middle Creek Elementary School, Holly Ridge Middle School, and Middle Creek High.
Ownership History
Date
Name
Owned For
Owner Type
Purchase Details
Closed on
Mar 9, 2010
Sold by
Brienzi Jennifer Corbin and Briezi Thomas J
Bought by
Brienzi Thomas J
Current Estimated Value
Purchase Details
Closed on
Nov 15, 2001
Sold by
Brienzi Thomas J and Brienzi Carl A
Bought by
Briezi Thomas J and Corbin Jennifer
Home Financials for this Owner
Home Financials are based on the most recent Mortgage that was taken out on this home.
Original Mortgage
$131,790
Outstanding Balance
$51,016
Interest Rate
6.59%
Mortgage Type
FHA
Estimated Equity
$345,854
Purchase Details
Closed on
Oct 31, 2000
Sold by
Miller Charles Andrew and Miller Jennifer Moore
Bought by
Brienzi Thomas J and Brienzi Carl A
Home Financials for this Owner
Home Financials are based on the most recent Mortgage that was taken out on this home.
Original Mortgage
$132,004
Interest Rate
7.94%
Mortgage Type
FHA
Create a Home Valuation Report for This Property
The Home Valuation Report is an in-depth analysis detailing your home's value as well as a comparison with similar homes in the area
Home Values in the Area
Average Home Value in this Area
Purchase History
| Date | Buyer | Sale Price | Title Company |
|---|---|---|---|
| Brienzi Thomas J | -- | None Available | |
| Briezi Thomas J | -- | -- | |
| Brienzi Thomas J | $133,000 | -- |
Source: Public Records
Mortgage History
| Date | Status | Borrower | Loan Amount |
|---|---|---|---|
| Open | Briezi Thomas J | $131,790 | |
| Closed | Brienzi Thomas J | $132,004 |
Source: Public Records
Tax History Compared to Growth
Tax History
| Year | Tax Paid | Tax Assessment Tax Assessment Total Assessment is a certain percentage of the fair market value that is determined by local assessors to be the total taxable value of land and additions on the property. | Land | Improvement |
|---|---|---|---|---|
| 2025 | -- | $334,390 | $130,000 | $204,390 |
| 2024 | $427 | $334,390 | $130,000 | $204,390 |
| 2023 | $1,704 | $215,963 | $70,000 | $145,963 |
| 2022 | $1,580 | $215,963 | $70,000 | $145,963 |
| 2021 | $1,538 | $215,963 | $70,000 | $145,963 |
| 2020 | $1,512 | $215,963 | $70,000 | $145,963 |
| 2019 | $1,222 | $147,146 | $35,000 | $112,146 |
| 2018 | $1,124 | $147,146 | $35,000 | $112,146 |
| 2017 | $1,066 | $147,146 | $35,000 | $112,146 |
| 2016 | $1,045 | $147,146 | $35,000 | $112,146 |
| 2015 | $1,194 | $168,987 | $58,000 | $110,987 |
| 2014 | -- | $168,987 | $58,000 | $110,987 |
Source: Public Records
Map
Nearby Homes
- 9640 Holly Springs Rd
- 5033 Sunset Lake Rd
- 4900 Optimist Farm Rd
- 4830 Optimist Farm Rd
- 116 Seagraves Creek Ln
- 107 Ransomwood Dr
- 200 Seagraves Creek Ln
- 103 Pleasant Glen Ln
- 157 Writing Rock Place
- 155 Writing Rock Place
- 208 Bellagio Dr
- 237 Bally Shannon Way
- 115 Bowerbank Ln
- 4721 Edwards Dr
- 104 Highland Mist Cir
- 109 Skywater Ln
- 120 Breyla Way
- 4724 Sunset Lake Rd
- 0 Optimist Farm Rd Unit 10126506
- 608 Skygrove Dr
- 9029 Wesley Ct
- 9021 Wesley Ct
- 9028 Wesley Ct
- 9017 Wesley Ct
- 9024 Wesley Ct
- 9709 Holly Springs Rd
- 9709 Holly Springs Rd Unit 7
- 9701 Holly Springs Rd
- 9013 Wesley Ct
- 4313 Suncliffe Ct
- 9713 Holly Springs Rd
- 4316 Suncliffe Ct
- 5200 Catherine Place
- 4312 Suncliffe Ct
- 9009 Wesley Ct
- 4309 Suncliffe Ct
- 4317 Public Dr
- 9717 Holly Springs Rd
- 9008 Wesley Ct
- 9725 Holly Springs Rd