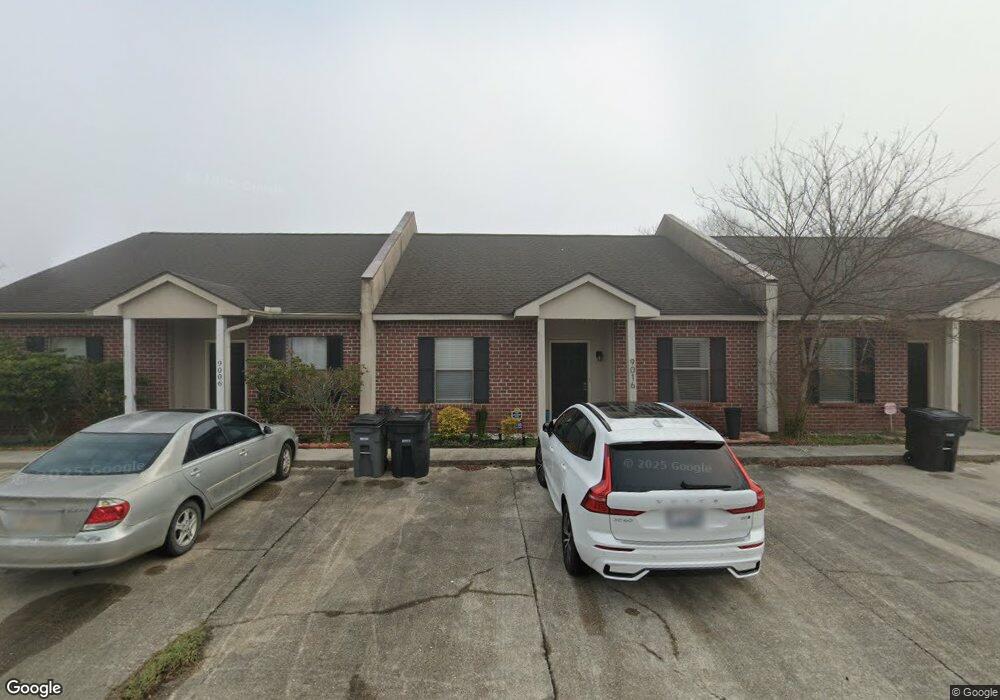
9026 Pecan Tree Dr Unit 80-A-1 Baton Rouge, LA 70810
Estimated Value: $140,000 - $158,874
3
Beds
2
Baths
1,152
Sq Ft
$130/Sq Ft
Est. Value
About This Home
This home is located at 9026 Pecan Tree Dr Unit 80-A-1, Baton Rouge, LA 70810 and is currently estimated at $149,469, approximately $129 per square foot. 9026 Pecan Tree Dr Unit 80-A-1 is a home located in East Baton Rouge Parish with nearby schools including Westdale Middle School, Tara High School, and South Baton Rouge Charter Academy.
Ownership History
Date
Name
Owned For
Owner Type
Purchase Details
Closed on
May 19, 2022
Sold by
Parks Kayla
Bought by
Simon Evelyn
Current Estimated Value
Purchase Details
Closed on
Nov 22, 2021
Sold by
Carney Morris Bradley and Carney Katherine Tolliver
Bought by
Green Kenya D
Home Financials for this Owner
Home Financials are based on the most recent Mortgage that was taken out on this home.
Original Mortgage
$127,645
Interest Rate
3.05%
Mortgage Type
FHA
Purchase Details
Closed on
Jul 7, 2006
Sold by
Waldrop Janet E
Bought by
Carney Morris B
Home Financials for this Owner
Home Financials are based on the most recent Mortgage that was taken out on this home.
Original Mortgage
$96,400
Interest Rate
6.63%
Mortgage Type
New Conventional
Purchase Details
Closed on
May 10, 2004
Sold by
Consortium Eastside
Bought by
Waldrop Janet
Create a Home Valuation Report for This Property
The Home Valuation Report is an in-depth analysis detailing your home's value as well as a comparison with similar homes in the area
Home Values in the Area
Average Home Value in this Area
Purchase History
| Date | Buyer | Sale Price | Title Company |
|---|---|---|---|
| Simon Evelyn | $130,000 | -- | |
| Green Kenya D | $135,000 | Accent Title Llc | |
| Carney Morris B | $120,500 | -- | |
| Waldrop Janet | $92,000 | -- |
Source: Public Records
Mortgage History
| Date | Status | Borrower | Loan Amount |
|---|---|---|---|
| Previous Owner | Green Kenya D | $127,645 | |
| Previous Owner | Carney Morris B | $96,400 |
Source: Public Records
Tax History Compared to Growth
Tax History
| Year | Tax Paid | Tax Assessment Tax Assessment Total Assessment is a certain percentage of the fair market value that is determined by local assessors to be the total taxable value of land and additions on the property. | Land | Improvement |
|---|---|---|---|---|
| 2024 | $687 | $12,830 | $400 | $12,430 |
| 2023 | $687 | $12,830 | $400 | $12,430 |
| 2022 | $1,542 | $12,830 | $400 | $12,430 |
| 2021 | $1,328 | $11,200 | $400 | $10,800 |
| 2020 | $1,316 | $11,200 | $400 | $10,800 |
| 2019 | $1,369 | $11,200 | $400 | $10,800 |
| 2018 | $1,352 | $11,200 | $400 | $10,800 |
| 2017 | $1,352 | $11,200 | $400 | $10,800 |
| 2016 | $1,319 | $11,200 | $400 | $10,800 |
| 2015 | $1,413 | $12,050 | $400 | $11,650 |
| 2014 | $1,383 | $12,050 | $400 | $11,650 |
| 2013 | -- | $12,050 | $400 | $11,650 |
Source: Public Records
Map
Nearby Homes
- 9024 Pecan Tree Dr
- 8826 Pecan Tree Dr
- 9131 Ridge Pecan Dr
- 9919 Glerma Dr
- 10240 Burbank Dr
- 8911 Gsri Ave Unit 1325 D
- 1646 Jade Ave
- 8805 Gsri Ave
- 8734 Gsri Ave
- 1179 Springlake Dr
- 1636 Jade Ave
- 8828 Gsri Ave
- TBD Bonnet Cove Ave
- 8818 Gsri Ave
- 9132 Gsri Ave
- 1835 Fountain Ave
- 1335 Springlake Dr
- 9527 Greenchase Dr
- 809 Summer Breeze Dr Unit 703
- 809 Summer Breeze Dr Unit 1405
- 9026 Pecan Tree Dr
- 9046 Pecan Tree Dr
- 9046 Pecan Tree Dr Unit 78-A-1
- 9016 Pecan Tree Dr
- 9016 Pecan Tree Dr Unit 81-A-1
- 9036 Pecan Tree Dr
- 9036 Pecan Tree Dr Unit 79-A-1
- 9056 Pecan Tree Dr
- 9056 Pecan Tree Dr Unit 77-A-1
- 9006 Pecan Tree Dr
- 9006 Pecan Tree Dr Unit 82-A-1
- 9128 Pecan Tree Dr
- 9138 Pecan Tree Dr
- 9108 Pecan Tree Dr
- 9066 Pecan Tree Dr
- 9066 Pecan Tree Dr Unit 76-A-1
- 9148 Pecan Tree Dr
- 9044 Pecan Tree Dr
- 9118 Pecan Tree Dr
- 9014 Pecan Tree Dr