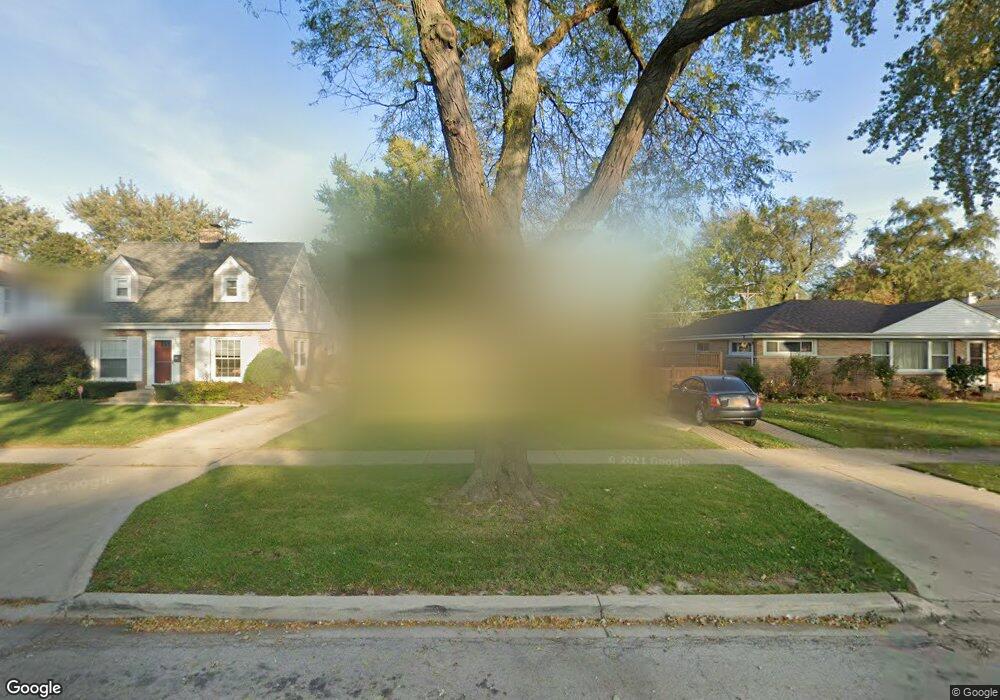
9027 Central Ave Morton Grove, IL 60053
Estimated Value: $416,000 - $465,000
3
Beds
2
Baths
1,200
Sq Ft
$370/Sq Ft
Est. Value
About This Home
This home is located at 9027 Central Ave, Morton Grove, IL 60053 and is currently estimated at $443,798, approximately $369 per square foot. 9027 Central Ave is a home located in Cook County with nearby schools including Park View Elementary School, Niles West High School, and Arie Crown Hebrew Day School.
Ownership History
Date
Name
Owned For
Owner Type
Purchase Details
Closed on
Apr 22, 2011
Sold by
Fannie Mae
Bought by
Joks Dariusz
Current Estimated Value
Home Financials for this Owner
Home Financials are based on the most recent Mortgage that was taken out on this home.
Original Mortgage
$132,000
Outstanding Balance
$86,471
Interest Rate
3.75%
Mortgage Type
New Conventional
Estimated Equity
$357,327
Purchase Details
Closed on
Mar 16, 2011
Sold by
Cco Mortgage
Bought by
Federal National Mortgage Association
Home Financials for this Owner
Home Financials are based on the most recent Mortgage that was taken out on this home.
Original Mortgage
$132,000
Outstanding Balance
$86,471
Interest Rate
3.75%
Mortgage Type
New Conventional
Estimated Equity
$357,327
Purchase Details
Closed on
Oct 19, 2010
Sold by
Mathew Dominic T and Mathew Dominic Kunjumol
Bought by
Cco Mortgage
Create a Home Valuation Report for This Property
The Home Valuation Report is an in-depth analysis detailing your home's value as well as a comparison with similar homes in the area
Home Values in the Area
Average Home Value in this Area
Purchase History
| Date | Buyer | Sale Price | Title Company |
|---|---|---|---|
| Joks Dariusz | $165,000 | First American Title | |
| Federal National Mortgage Association | -- | First American Title | |
| Cco Mortgage | -- | None Available |
Source: Public Records
Mortgage History
| Date | Status | Borrower | Loan Amount |
|---|---|---|---|
| Open | Joks Dariusz | $132,000 |
Source: Public Records
Tax History Compared to Growth
Tax History
| Year | Tax Paid | Tax Assessment Tax Assessment Total Assessment is a certain percentage of the fair market value that is determined by local assessors to be the total taxable value of land and additions on the property. | Land | Improvement |
|---|---|---|---|---|
| 2024 | $4,176 | $16,116 | $3,770 | $12,346 |
| 2023 | $3,964 | $16,116 | $3,770 | $12,346 |
| 2022 | $3,964 | $16,116 | $3,770 | $12,346 |
| 2021 | $3,576 | $12,814 | $2,320 | $10,494 |
| 2020 | $3,517 | $12,814 | $2,320 | $10,494 |
| 2019 | $3,551 | $14,398 | $2,320 | $12,078 |
| 2018 | $3,397 | $12,483 | $2,102 | $10,381 |
| 2017 | $3,636 | $13,125 | $2,102 | $11,023 |
| 2016 | $3,559 | $13,125 | $2,102 | $11,023 |
| 2015 | $2,708 | $9,714 | $1,812 | $7,902 |
| 2014 | $2,958 | $10,472 | $1,812 | $8,660 |
| 2013 | $2,881 | $10,472 | $1,812 | $8,660 |
Source: Public Records
Map
Nearby Homes
- 5449 Arcadia St
- 5536 Greenwood St
- 5459 Suffield Ct
- 8918 Parkside Ave
- 5346 Suffield Terrace
- 9234 Central Ave
- 5352 Greenwood St
- 5317 Suffield Ct
- 8841 Menard Ave
- 5644 Lyons St
- 9224 Menard Ave
- 5247 Suffield Ct
- 8708 Central Ave
- 8836 Mansfield Ave
- 9314 Menard Ave
- 9320 Menard Ave
- 8655 Harms Rd
- 5128 Suffield Ct
- 5309 Crain St
- 8717 Gross Point Rd
- 9027 Central Ave
- 9031 Harms Rd
- 9031 Central Ave
- 9031 Central Ave
- 9023 Central Ave
- 9035 Central Ave
- 9035 Central Ave
- 9039 Central Ave
- 9039 Central Ave
- 9019 Harms Rd
- 9024 Luna Ave
- 9028 Luna Ave
- 9020 Luna Ave
- 9013 Harms Rd
- 9016 Luna Ave
- 9041 Central Ave
- 9041 Central Ave
- 9036 Luna Ave
- 9026 Central Ave
- 9026 Central Ave