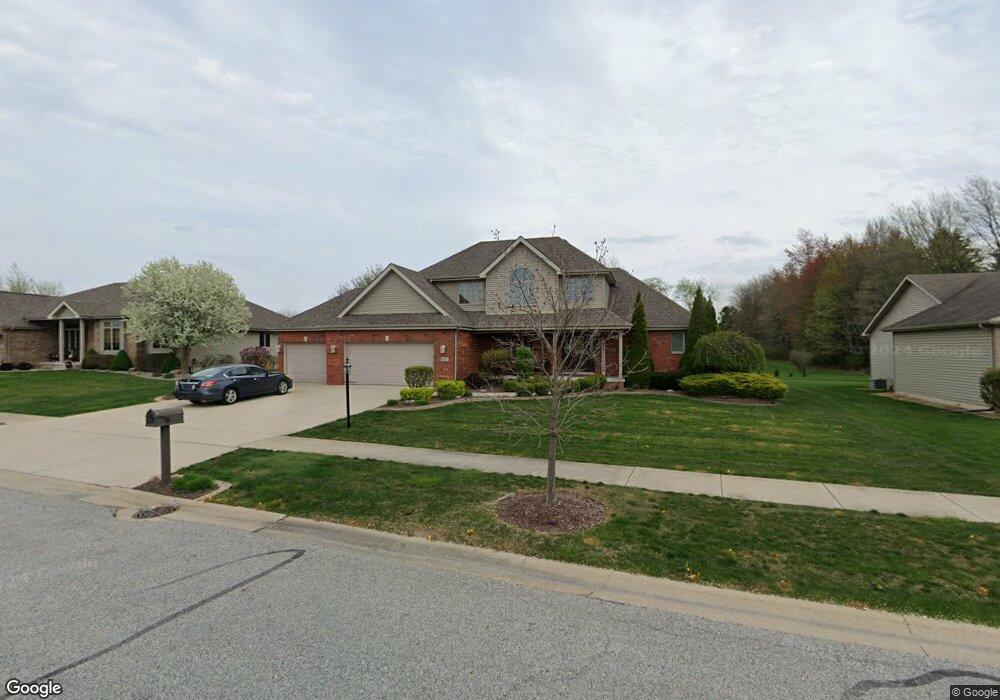
9027 Mallard Ln Saint John, IN 46373
Saint John NeighborhoodEstimated Value: $499,718 - $589,000
4
Beds
3
Baths
2,257
Sq Ft
$235/Sq Ft
Est. Value
About This Home
This home is located at 9027 Mallard Ln, Saint John, IN 46373 and is currently estimated at $529,930, approximately $234 per square foot. 9027 Mallard Ln is a home located in Lake County with nearby schools including Kolling Elementary School, Hal E Clark Middle School, and Lake Central High School.
Ownership History
Date
Name
Owned For
Owner Type
Purchase Details
Closed on
Jul 16, 2014
Sold by
Ollearis William and Ollearis Angela
Bought by
Ollearis Angela and Ollearis William
Current Estimated Value
Home Financials for this Owner
Home Financials are based on the most recent Mortgage that was taken out on this home.
Original Mortgage
$284,700
Outstanding Balance
$220,534
Interest Rate
4.62%
Mortgage Type
Adjustable Rate Mortgage/ARM
Estimated Equity
$309,396
Purchase Details
Closed on
Aug 14, 2008
Sold by
Kurt Graves Construction Inc
Bought by
Ollearis William and Ollearis Angela
Home Financials for this Owner
Home Financials are based on the most recent Mortgage that was taken out on this home.
Original Mortgage
$287,600
Interest Rate
6.42%
Mortgage Type
Purchase Money Mortgage
Purchase Details
Closed on
Oct 30, 2007
Sold by
Tram Development Group Inc
Bought by
Kurt Graves Construction Inc
Create a Home Valuation Report for This Property
The Home Valuation Report is an in-depth analysis detailing your home's value as well as a comparison with similar homes in the area
Home Values in the Area
Average Home Value in this Area
Purchase History
| Date | Buyer | Sale Price | Title Company |
|---|---|---|---|
| Ollearis Angela | -- | None Available | |
| Ollearis William | -- | So Ticor | |
| Kurt Graves Construction Inc | -- | Ticor Mo |
Source: Public Records
Mortgage History
| Date | Status | Borrower | Loan Amount |
|---|---|---|---|
| Open | Ollearis Angela | $284,700 | |
| Closed | Ollearis William | $287,600 |
Source: Public Records
Tax History Compared to Growth
Tax History
| Year | Tax Paid | Tax Assessment Tax Assessment Total Assessment is a certain percentage of the fair market value that is determined by local assessors to be the total taxable value of land and additions on the property. | Land | Improvement |
|---|---|---|---|---|
| 2024 | $7,932 | $401,800 | $68,700 | $333,100 |
| 2023 | $3,727 | $392,300 | $68,700 | $323,600 |
| 2022 | $4,121 | $383,600 | $68,700 | $314,900 |
| 2021 | $3,897 | $371,900 | $68,700 | $303,200 |
| 2020 | $3,777 | $350,600 | $68,700 | $281,900 |
| 2019 | $4,071 | $348,600 | $61,300 | $287,300 |
| 2018 | $4,205 | $347,800 | $61,300 | $286,500 |
| 2017 | $4,168 | $355,800 | $54,000 | $301,800 |
| 2016 | $4,024 | $346,300 | $45,100 | $301,200 |
| 2014 | $4,130 | $367,600 | $45,100 | $322,500 |
| 2013 | $4,197 | $367,000 | $45,100 | $321,900 |
Source: Public Records
Map
Nearby Homes
- 8950 Marquette St
- 6640 W 89th Ave
- 8312 Wyman Dr
- The Torbet Plan at Walden Clearing - Manors at Walden Clearing
- Dune Plan at Walden Clearing - Manors at Walden Clearing
- The Harper Plan at Walden Clearing - Manors at Walden Clearing
- The Princeton Plan at Walden Clearing - Manors at Walden Clearing
- Harrison Plan at Walden Clearing - Manors at Walden Clearing
- The Powell II Plan at Walden Clearing - Manors at Walden Clearing
- The Augusta Plan at Walden Clearing - Manors at Walden Clearing
- Clifty Plan at Walden Clearing - Manors at Walden Clearing
- Martin Plan at Walden Clearing - Manors at Walden Clearing
- The Bennett Plan at Walden Clearing - Manors at Walden Clearing
- The Elbert Plan at Walden Clearing - Manors at Walden Clearing
- The Rainier Plan at Walden Clearing - Manors at Walden Clearing
- The Huxley Plan at Walden Clearing - Manors at Walden Clearing
- 8905 Willow Ln
- 9270 W 93rd Ave
- Dune Plan at Rose Garden
- Clifty Plan at Rose Garden
- 9037 Mallard Ln
- 9017 Mallard Ln
- 8337 W 89th Place
- 9005 Mallard Ln
- 9047 Mallard Ln
- 9022 Mallard Ln
- 9032 Mallard Ln
- 9012 Mallard Ln
- 9042 Mallard Ln
- 8927 Mallard Ln
- 9105 Mallard Ln
- 9000 Mallard Ln
- 9100 Mallard Ln
- 9023 Teal Place
- 9033 Teal Place
- 9013 Teal Place
- 8901 Mallard Ln
- 9043 Teal Place
- 9110 Mallard Ln
- 9001 Teal Place