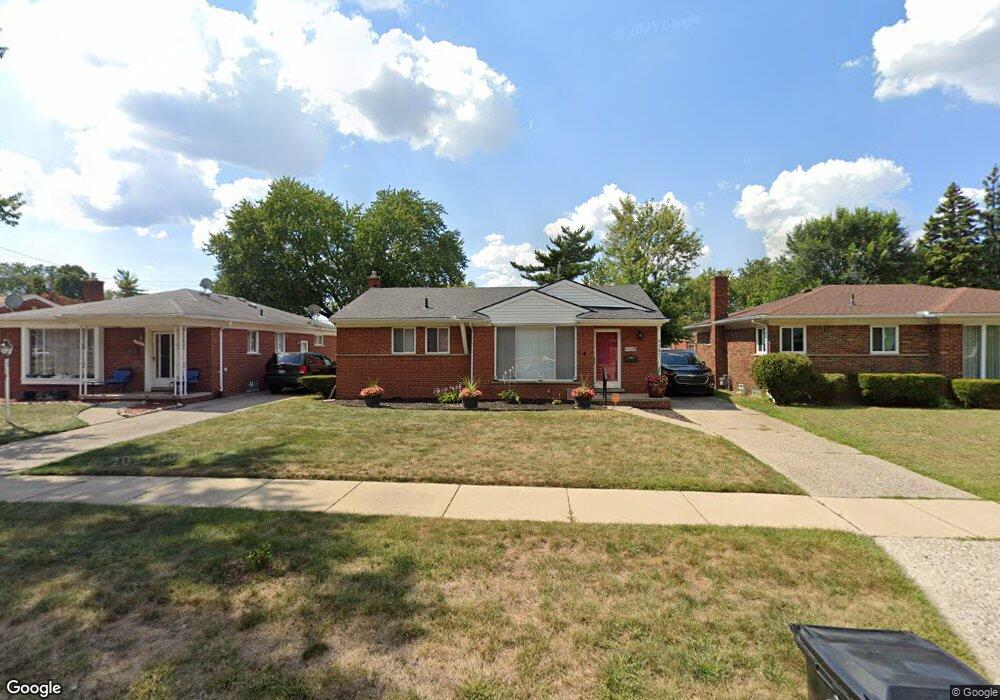
9027 Riverview Redford, MI 48239
Estimated Value: $197,000 - $208,000
3
Beds
2
Baths
1,100
Sq Ft
$184/Sq Ft
Est. Value
About This Home
This home is located at 9027 Riverview, Redford, MI 48239 and is currently estimated at $201,867, approximately $183 per square foot. 9027 Riverview is a home located in Wayne County with nearby schools including John D. Pierce Middle School, Lee M. Thurston High School, and Global Heights Academy.
Ownership History
Date
Name
Owned For
Owner Type
Purchase Details
Closed on
Sep 23, 2011
Sold by
Ramirez Maria and Ramirez Mary Sylvia
Bought by
Kelly Tameka
Current Estimated Value
Purchase Details
Closed on
Nov 12, 2009
Sold by
Donovan Shaun and Secretary Of Housing & Urban D
Bought by
Ramirez Maria
Purchase Details
Closed on
Sep 11, 2008
Sold by
M & T Bank
Bought by
The Secretary Of Housing & Urban Develop
Purchase Details
Closed on
Feb 21, 2008
Sold by
Davenport Paul E and Boyer Patricia D
Bought by
M & T Bank
Purchase Details
Closed on
Oct 6, 2000
Sold by
Koss Lynda S
Bought by
Koss Lynda S
Create a Home Valuation Report for This Property
The Home Valuation Report is an in-depth analysis detailing your home's value as well as a comparison with similar homes in the area
Home Values in the Area
Average Home Value in this Area
Purchase History
| Date | Buyer | Sale Price | Title Company |
|---|---|---|---|
| Kelly Tameka | $62,000 | Capital Title Ins Agency | |
| Ramirez Maria | $28,100 | None Available | |
| The Secretary Of Housing & Urban Develop | -- | None Available | |
| M & T Bank | $126,200 | None Available | |
| Koss Lynda S | -- | -- |
Source: Public Records
Tax History
| Year | Tax Paid | Tax Assessment Tax Assessment Total Assessment is a certain percentage of the fair market value that is determined by local assessors to be the total taxable value of land and additions on the property. | Land | Improvement |
|---|---|---|---|---|
| 2025 | $761 | $86,800 | $0 | $0 |
| 2024 | $740 | $77,700 | $0 | $0 |
| 2023 | $709 | $67,500 | $0 | $0 |
| 2022 | $2,092 | $57,800 | $0 | $0 |
| 2021 | $2,033 | $55,400 | $0 | $0 |
| 2020 | $2,005 | $49,600 | $0 | $0 |
| 2019 | $1,963 | $38,600 | $0 | $0 |
| 2018 | $638 | $32,800 | $0 | $0 |
| 2017 | $2,208 | $30,400 | $0 | $0 |
| 2016 | $1,721 | $28,500 | $0 | $0 |
| 2015 | $2,680 | $26,800 | $0 | $0 |
| 2013 | $3,040 | $31,300 | $0 | $0 |
| 2012 | $1,870 | $33,700 | $6,900 | $26,800 |
Source: Public Records
Map
Nearby Homes
Your Personal Tour Guide
Ask me questions while you tour the home.