Estimated Value: $524,000 - $540,149
3
Beds
3
Baths
2,102
Sq Ft
$254/Sq Ft
Est. Value
About This Home
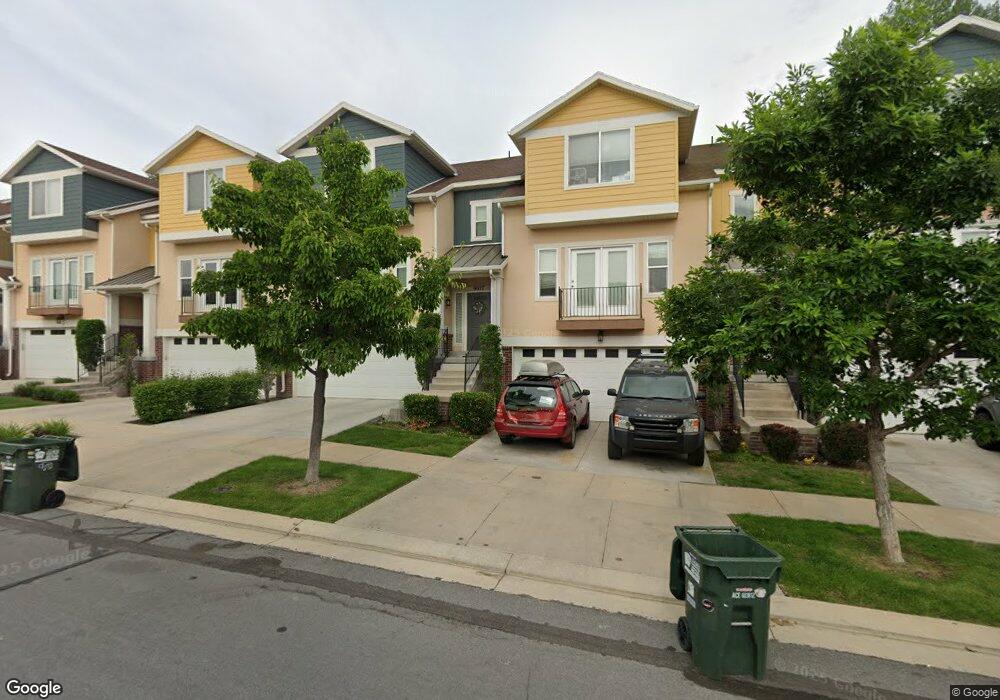
This home is located at 9027 S Quarry Stone Way Unit 15-3, Sandy, UT 84094 and is currently estimated at $533,037, approximately $253 per square foot. 9027 S Quarry Stone Way Unit 15-3 is a home located in Salt Lake County with nearby schools including Crescent Elementary School, Union Middle School, and Hillcrest High School.
Ownership History
Date
Name
Owned For
Owner Type
Purchase Details
Closed on
Aug 22, 2014
Sold by
Melby Kathy
Bought by
Melby Kathryn Wendy and The Kwm Trust
Current Estimated Value
Purchase Details
Closed on
Nov 19, 2010
Sold by
Melby Kathryn W
Bought by
Melby Kathy
Home Financials for this Owner
Home Financials are based on the most recent Mortgage that was taken out on this home.
Original Mortgage
$263,432
Outstanding Balance
$172,832
Interest Rate
4.16%
Mortgage Type
FHA
Estimated Equity
$360,205
Purchase Details
Closed on
Feb 12, 2009
Sold by
Melby Kathryn W
Bought by
Melby Kathryn W and The Kwm Trust
Home Financials for this Owner
Home Financials are based on the most recent Mortgage that was taken out on this home.
Original Mortgage
$265,010
Interest Rate
5.01%
Mortgage Type
FHA
Create a Home Valuation Report for This Property
The Home Valuation Report is an in-depth analysis detailing your home's value as well as a comparison with similar homes in the area
Home Values in the Area
Average Home Value in this Area
Purchase History
| Date | Buyer | Sale Price | Title Company |
|---|---|---|---|
| Melby Kathryn Wendy | -- | None Available | |
| Melby Kathy | -- | Cottonwood Title | |
| Melby Kathryn W | -- | Accommodation | |
| Melby Kathryn W | -- | Equity Title |
Source: Public Records
Mortgage History
| Date | Status | Borrower | Loan Amount |
|---|---|---|---|
| Open | Melby Kathy | $263,432 | |
| Closed | Melby Kathryn W | $265,010 |
Source: Public Records
Tax History Compared to Growth
Tax History
| Year | Tax Paid | Tax Assessment Tax Assessment Total Assessment is a certain percentage of the fair market value that is determined by local assessors to be the total taxable value of land and additions on the property. | Land | Improvement |
|---|---|---|---|---|
| 2025 | $2,757 | $518,100 | $54,100 | $464,000 |
| 2024 | $2,757 | $509,800 | $50,700 | $459,100 |
| 2023 | $2,545 | $469,300 | $48,200 | $421,100 |
| 2022 | $2,609 | $470,000 | $47,300 | $422,700 |
| 2021 | $2,302 | $353,000 | $39,600 | $313,400 |
| 2020 | $2,223 | $321,400 | $39,600 | $281,800 |
| 2019 | $2,115 | $298,000 | $37,300 | $260,700 |
| 2018 | $2,016 | $295,700 | $56,700 | $239,000 |
| 2017 | $2,013 | $282,200 | $56,700 | $225,500 |
| 2016 | $2,052 | $278,000 | $88,400 | $189,600 |
| 2015 | $1,814 | $227,400 | $86,700 | $140,700 |
| 2014 | $1,759 | $216,200 | $84,000 | $132,200 |
Source: Public Records
Map
Nearby Homes
- 8935 Quarry Stone Way
- 9083 Enchanted Oak Ln
- 9144 S Peach Blossom Dr
- 9092 Enchanted Oak Ln
- 1368 Silvercrest Dr
- 807 E Whisper Cove Rd
- 1393 E Galaxie Dr
- 1100 E Webster Dr
- 8731 Gladiator Way
- 9439 S Meckailee Cove
- 783 E Newfield Dr Unit 146
- 8657 S 910 E
- 9464 S Meckailee Cove
- 775 E Autumn Field Dr
- 1430 E 8685 S
- 1492 E Sandy Hills Dr
- 8797 Green Way Unit 3
- 8722 S Oakwood Park Cir Unit 8722
- 1616 Waters Ln
- 8729 S Leafwood Ln
- 9027 Quarry Stone Way
- 9023 Quarry Stone Way
- 9023 S Quarry Stone Way
- 9031 S Quarry Stone Way Unit 15-4
- 9031 S Quarry Stone Way
- 9031 S Quarry Stone Way
- 9019 S Quarry Stone Way
- 9035 Quarry Stone Way
- 9035 S Quarry Stone Way Unit 15-5
- 9019 Quarry Stone Way
- 9013 Quarry Stone Way
- 9041 Quarry Stone Way
- 9009 S Quarry Stone Way
- 9009 Quarry Stone Way
- 9024 S Quarry Stone Way
- 9028 S Quarry Stone Way
- 9045 S Quarry Stone Way Unit 16-2
- 9045 Quarry Stone Way
- 9028 Quarry Stone Way
- 9020 Quarry Stone Way