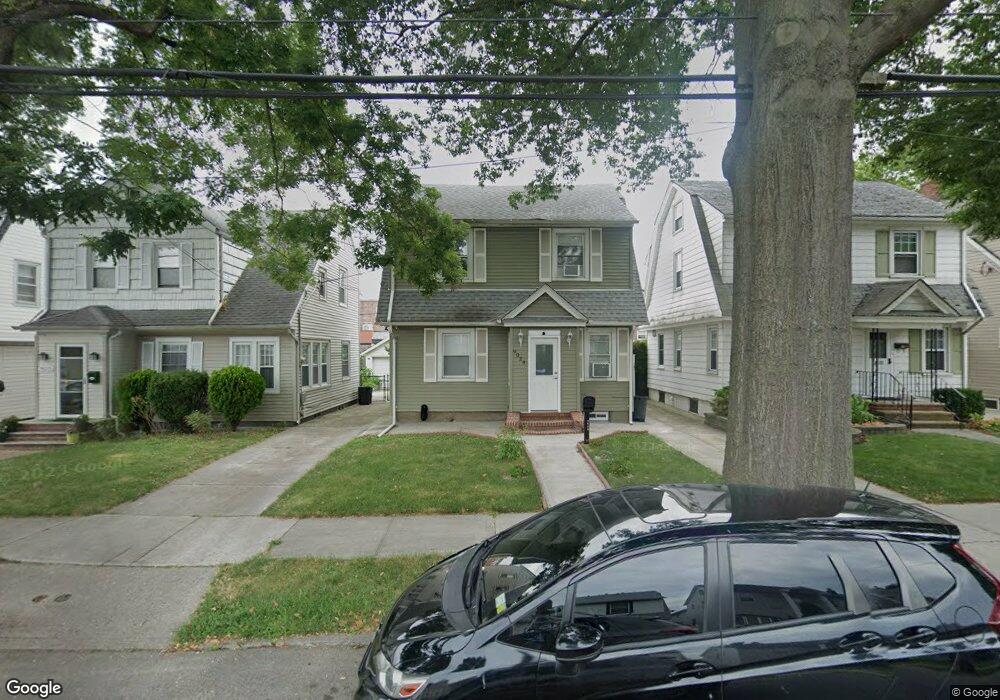
9029 205th St Hollis, NY 11423
Hollis NeighborhoodEstimated Value: $709,634 - $775,000
--
Bed
--
Bath
1,152
Sq Ft
$649/Sq Ft
Est. Value
About This Home
This home is located at 9029 205th St, Hollis, NY 11423 and is currently estimated at $747,409, approximately $648 per square foot. 9029 205th St is a home located in Queens County with nearby schools including The Bellaire School, Jean Nuzzi Intermediate School, and Incarnation Catholic Academy.
Ownership History
Date
Name
Owned For
Owner Type
Purchase Details
Closed on
Mar 23, 2020
Sold by
Rahman Sazedur
Bought by
Rahman Hosneara F and Rahman Sazedur
Current Estimated Value
Home Financials for this Owner
Home Financials are based on the most recent Mortgage that was taken out on this home.
Original Mortgage
$325,000
Outstanding Balance
$286,731
Interest Rate
3.3%
Mortgage Type
New Conventional
Estimated Equity
$460,678
Purchase Details
Closed on
Dec 21, 2012
Sold by
Larkin As Specific Devisee Thomas
Bought by
Rahman Sazedur
Home Financials for this Owner
Home Financials are based on the most recent Mortgage that was taken out on this home.
Original Mortgage
$365,750
Interest Rate
3.38%
Mortgage Type
New Conventional
Purchase Details
Closed on
Mar 30, 2005
Sold by
Larkin Kathryn
Bought by
Larkin-Wiegert Lorraine C
Create a Home Valuation Report for This Property
The Home Valuation Report is an in-depth analysis detailing your home's value as well as a comparison with similar homes in the area
Home Values in the Area
Average Home Value in this Area
Purchase History
| Date | Buyer | Sale Price | Title Company |
|---|---|---|---|
| Rahman Hosneara F | -- | -- | |
| Rahman Hosneara F | -- | -- | |
| Rahman Sazedur | $385,000 | -- | |
| Rahman Sazedur | $385,000 | -- | |
| Larkin-Wiegert Lorraine C | -- | -- | |
| Larkin-Wiegert Lorraine C | -- | -- |
Source: Public Records
Mortgage History
| Date | Status | Borrower | Loan Amount |
|---|---|---|---|
| Open | Rahman Hosneara F | $325,000 | |
| Closed | Rahman Hosneara F | $325,000 | |
| Previous Owner | Rahman Sazedur | $365,750 |
Source: Public Records
Tax History Compared to Growth
Tax History
| Year | Tax Paid | Tax Assessment Tax Assessment Total Assessment is a certain percentage of the fair market value that is determined by local assessors to be the total taxable value of land and additions on the property. | Land | Improvement |
|---|---|---|---|---|
| 2025 | $5,956 | $32,912 | $10,027 | $22,885 |
| 2024 | $5,968 | $31,054 | $9,908 | $21,146 |
| 2023 | $5,652 | $29,539 | $10,443 | $19,096 |
| 2022 | $5,276 | $38,280 | $12,960 | $25,320 |
| 2021 | $5,569 | $36,240 | $12,960 | $23,280 |
| 2020 | $5,509 | $35,640 | $12,960 | $22,680 |
| 2019 | $5,121 | $31,080 | $12,960 | $18,120 |
| 2018 | $4,720 | $24,616 | $10,963 | $13,653 |
| 2017 | $4,434 | $23,223 | $11,222 | $12,001 |
| 2016 | $4,333 | $23,223 | $11,222 | $12,001 |
| 2015 | $1,675 | $22,856 | $12,610 | $10,246 |
| 2014 | $1,675 | $21,565 | $12,971 | $8,594 |
Source: Public Records
Map
Nearby Homes
- 90-36 Francis Lewis Blvd
- 90-13 Francis Lewis Blvd
- 90-32 207th St
- 9048 204th St
- 90-62 204th St
- 8919 205th St
- 89-28 207th St
- 9051 201st St
- 9302 202nd St
- 89-42 202nd St
- 9331 207th St
- 93-17 201st St
- 90-60 209th St
- 90-54 209th St
- 89-25 201st St
- 93-45 202nd St
- 9013 209th St
- 88-49 202nd St
- 9353 207th St
- 8840 207th St
- 90-29 205th St
- 9033 205th St
- 9025 205th St
- 90-35 205th St
- 9023 205th St
- 9035 205th St
- 9019 205th St
- 9039 205th St
- 9030 Francis Lewis Blvd
- 9028 Francis Lewis Blvd
- 9032 Francis Lewis Blvd
- 9026 Francis Lewis Blvd
- 90-34 Francis Lewis Blvd
- 90-28 Francis Lewis Blvd
- 9034 Francis Lewis Blvd
- 9024 Francis Lewis Blvd
- 90-30 Francis Lewis Blvd Unit Ph
- 9022 Francis Lewis Blvd
- 9036 Francis Lewis Blvd
- 9043 205th St