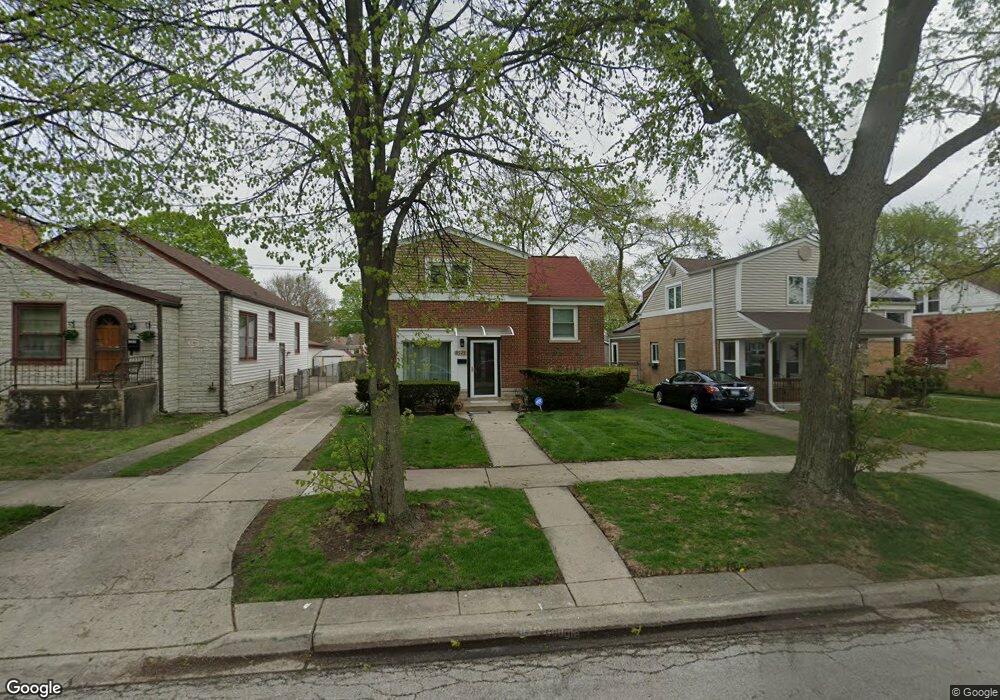
9029 Marmora Ave Morton Grove, IL 60053
Estimated Value: $504,677 - $626,000
3
Beds
3
Baths
1,948
Sq Ft
$278/Sq Ft
Est. Value
About This Home
This home is located at 9029 Marmora Ave, Morton Grove, IL 60053 and is currently estimated at $540,919, approximately $277 per square foot. 9029 Marmora Ave is a home located in Cook County with nearby schools including Park View Elementary School and Niles West High School.
Ownership History
Date
Name
Owned For
Owner Type
Purchase Details
Closed on
Nov 30, 2017
Sold by
Altman Svetlana and Altman Eugene
Bought by
Alexander Ghusoun and Alexander Danny
Current Estimated Value
Home Financials for this Owner
Home Financials are based on the most recent Mortgage that was taken out on this home.
Original Mortgage
$272,000
Outstanding Balance
$230,057
Interest Rate
4.12%
Mortgage Type
New Conventional
Estimated Equity
$310,862
Create a Home Valuation Report for This Property
The Home Valuation Report is an in-depth analysis detailing your home's value as well as a comparison with similar homes in the area
Home Values in the Area
Average Home Value in this Area
Purchase History
| Date | Buyer | Sale Price | Title Company |
|---|---|---|---|
| Alexander Ghusoun | $340,000 | Chicago Title |
Source: Public Records
Mortgage History
| Date | Status | Borrower | Loan Amount |
|---|---|---|---|
| Open | Alexander Ghusoun | $272,000 |
Source: Public Records
Tax History Compared to Growth
Tax History
| Year | Tax Paid | Tax Assessment Tax Assessment Total Assessment is a certain percentage of the fair market value that is determined by local assessors to be the total taxable value of land and additions on the property. | Land | Improvement |
|---|---|---|---|---|
| 2024 | $9,729 | $37,001 | $7,313 | $29,688 |
| 2023 | $9,241 | $37,001 | $7,313 | $29,688 |
| 2022 | $9,241 | $37,001 | $7,313 | $29,688 |
| 2021 | $8,200 | $28,894 | $4,500 | $24,394 |
| 2020 | $8,053 | $28,894 | $4,500 | $24,394 |
| 2019 | $8,130 | $32,466 | $4,500 | $27,966 |
| 2018 | $7,601 | $27,524 | $4,078 | $23,446 |
| 2017 | $8,750 | $27,524 | $4,078 | $23,446 |
| 2016 | $6,965 | $27,524 | $4,078 | $23,446 |
| 2015 | $5,670 | $22,091 | $3,515 | $18,576 |
| 2014 | $5,694 | $22,091 | $3,515 | $18,576 |
| 2013 | $5,531 | $22,091 | $3,515 | $18,576 |
Source: Public Records
Map
Nearby Homes
- 8836 Mansfield Ave
- 8841 Menard Ave
- 9224 Menard Ave
- 8849 Mcvicker Ave
- 8918 Parkside Ave
- 9314 Menard Ave
- 9320 Menard Ave
- 5536 Greenwood St
- 5644 Lyons St
- 9234 Central Ave
- 5459 Suffield Ct
- 5449 Arcadia St
- 8708 Central Ave
- 5352 Greenwood St
- 8655 Harms Rd
- 6332 Hennings Ct
- 6330 Hennings Ct
- 6334 Hennings Ct
- 6336 Hennings Ct
- 6338 Hennings Ct
- 9033 Marmora Ave
- 9027 Marmora Ave
- 9023 Marmora Ave
- 9037 Marmora Ave
- 9019 Marmora Ave
- 9026 Mansfield Ave
- 9028 Mansfield Ave
- 9043 Marmora Ave
- 9022 Mansfield Ave
- 9036 Mansfield Ave
- 9015 Marmora Ave
- 9015 Marmora Ave
- 9020 Mansfield Ave
- 9032 Marmora Ave
- 9028 Marmora Ave
- 9045 Marmora Ave
- 9036 Marmora Ave
- 9038 Mansfield Ave
- 9040 Marmora Ave
- 9014 Mansfield Ave