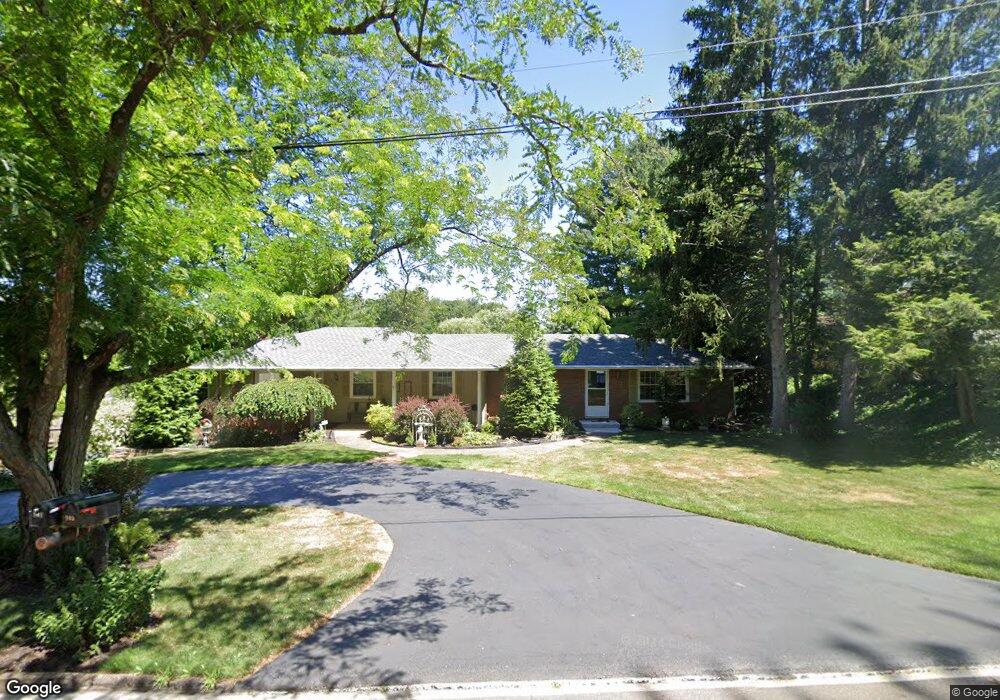
903 39th St NE Canton, OH 44714
Plain Township NeighborhoodEstimated Value: $264,000 - $315,291
5
Beds
4
Baths
2,303
Sq Ft
$128/Sq Ft
Est. Value
About This Home
This home is located at 903 39th St NE, Canton, OH 44714 and is currently estimated at $293,823, approximately $127 per square foot. 903 39th St NE is a home located in Stark County with nearby schools including Frazer Elementary School, Glenwood Intermediate School, and GlenOak High School.
Ownership History
Date
Name
Owned For
Owner Type
Purchase Details
Closed on
Nov 20, 2006
Sold by
Georgiades Chris and Georgiades Brenda
Bought by
Ott Denis P and Ott Donna F
Current Estimated Value
Home Financials for this Owner
Home Financials are based on the most recent Mortgage that was taken out on this home.
Original Mortgage
$148,400
Outstanding Balance
$88,518
Interest Rate
6.36%
Mortgage Type
Purchase Money Mortgage
Estimated Equity
$205,305
Purchase Details
Closed on
Sep 10, 2001
Sold by
Georgiades George J and Georgiades Lisa M
Bought by
Georgiades Chris and Georgiades Brenda
Home Financials for this Owner
Home Financials are based on the most recent Mortgage that was taken out on this home.
Original Mortgage
$144,000
Interest Rate
7.03%
Purchase Details
Closed on
Feb 26, 1993
Purchase Details
Closed on
Sep 18, 1991
Purchase Details
Closed on
May 17, 1990
Create a Home Valuation Report for This Property
The Home Valuation Report is an in-depth analysis detailing your home's value as well as a comparison with similar homes in the area
Home Values in the Area
Average Home Value in this Area
Purchase History
| Date | Buyer | Sale Price | Title Company |
|---|---|---|---|
| Ott Denis P | $185,500 | Attorney | |
| Georgiades Chris | $180,000 | Cta | |
| -- | $119,900 | -- | |
| -- | $21,000 | -- | |
| -- | $102,000 | -- |
Source: Public Records
Mortgage History
| Date | Status | Borrower | Loan Amount |
|---|---|---|---|
| Open | Ott Denis P | $148,400 | |
| Closed | Georgiades Chris | $144,000 |
Source: Public Records
Tax History Compared to Growth
Tax History
| Year | Tax Paid | Tax Assessment Tax Assessment Total Assessment is a certain percentage of the fair market value that is determined by local assessors to be the total taxable value of land and additions on the property. | Land | Improvement |
|---|---|---|---|---|
| 2025 | -- | $100,170 | $29,190 | $70,980 |
| 2024 | -- | $100,170 | $29,190 | $70,980 |
| 2023 | $2,571 | $63,810 | $15,160 | $48,650 |
| 2022 | $2,603 | $63,810 | $15,160 | $48,650 |
| 2021 | $2,615 | $63,810 | $15,160 | $48,650 |
| 2020 | $2,321 | $53,170 | $13,060 | $40,110 |
| 2019 | $2,302 | $53,170 | $13,060 | $40,110 |
| 2018 | $2,275 | $53,170 | $13,060 | $40,110 |
| 2017 | $2,267 | $49,390 | $12,110 | $37,280 |
| 2016 | $2,272 | $49,390 | $12,110 | $37,280 |
| 2015 | $2,198 | $49,390 | $12,110 | $37,280 |
| 2014 | $207 | $48,660 | $11,940 | $36,720 |
| 2013 | $1,077 | $48,660 | $11,940 | $36,720 |
Source: Public Records
Map
Nearby Homes
- 3922 Market Ave N
- 142 36th St NE
- 3619 Rowland Ave NE
- 1327 44th St NE
- 340 Lakecrest St NW
- 4015 Pelham St NE Unit 3A
- 4442 Logan Ave NW
- 360 Santa Clara St NW
- 3321 Martindale Rd NE
- 4012 Beechtree Cir NW
- 0 St Elmo Ave NE Unit 5159780
- 0 St Elmo Ave NE Unit 5089961
- 1428 35th St NE
- 4450 Dawnridge Cir NW
- 502 38th St NW
- 1601 33rd St NE
- 1902 39th St NE
- 1912 40th St NE
- 3122 Logan Ave NW
- 233 31st St NW
- 915 39th St NE
- 3918 Willowdell Dr NE
- 3939 Beverly Ave NE
- 3926 Willowdell Dr NE
- 3947 Beverly Ave NE
- 1003 39th St NE
- 4008 Willowdell Dr NE
- 808 39th St NE Unit 3a
- 808 39th St NE Unit 4
- 808 39th St NE Unit 1B
- 808 39th St NE Unit B
- 808 39th St NE Unit 3B
- 808 39th St NE
- 3940 Beverly Ave NE
- 3914 Willowdell Dr NE
- 1011 39th St NE
- 1000 39th St NE
- 3924 Willowdell Dr NE
- 3914 Willowdell Cir NE
- 4005 Beverly Ave NE