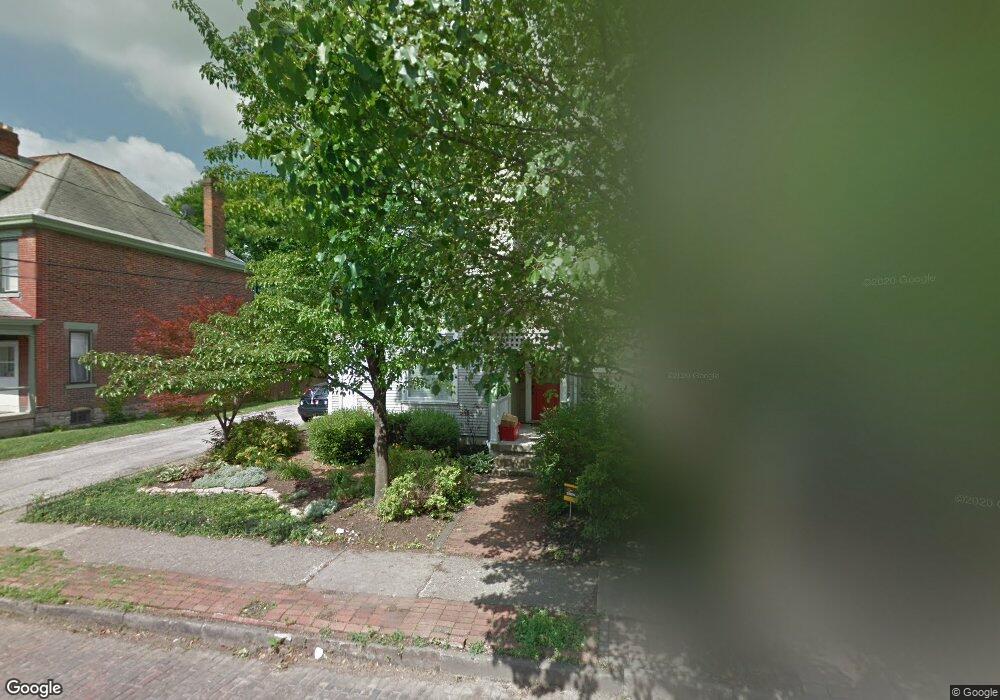
903 Beech St Columbus, OH 43206
Schumacher Place NeighborhoodEstimated Value: $464,735 - $536,000
3
Beds
2
Baths
1,771
Sq Ft
$287/Sq Ft
Est. Value
About This Home
This home is located at 903 Beech St, Columbus, OH 43206 and is currently estimated at $507,434, approximately $286 per square foot. 903 Beech St is a home located in Franklin County with nearby schools including Siebert Elementary School, South High School, and South Columbus Preparatory Academy.
Ownership History
Date
Name
Owned For
Owner Type
Purchase Details
Closed on
Jun 30, 2004
Sold by
Kerr John E
Bought by
Szopa Amy L and Cowell Shawn S
Current Estimated Value
Home Financials for this Owner
Home Financials are based on the most recent Mortgage that was taken out on this home.
Original Mortgage
$139,600
Outstanding Balance
$70,425
Interest Rate
6.37%
Mortgage Type
Purchase Money Mortgage
Estimated Equity
$437,009
Purchase Details
Closed on
Jan 31, 2001
Sold by
Williams Gregory W and Williams Kristin L
Bought by
Kerr John E
Purchase Details
Closed on
Jun 19, 1997
Sold by
Morris Kimberly M
Bought by
Williams Gregory W and Williams Kristin L
Home Financials for this Owner
Home Financials are based on the most recent Mortgage that was taken out on this home.
Original Mortgage
$95,000
Interest Rate
8%
Purchase Details
Closed on
Jul 25, 1995
Sold by
Walter Mary T
Bought by
Kimberly A Morris
Home Financials for this Owner
Home Financials are based on the most recent Mortgage that was taken out on this home.
Original Mortgage
$95,297
Interest Rate
7.5%
Mortgage Type
FHA
Purchase Details
Closed on
Mar 1, 1987
Create a Home Valuation Report for This Property
The Home Valuation Report is an in-depth analysis detailing your home's value as well as a comparison with similar homes in the area
Home Values in the Area
Average Home Value in this Area
Purchase History
| Date | Buyer | Sale Price | Title Company |
|---|---|---|---|
| Szopa Amy L | $174,500 | Amerititle | |
| Kerr John E | $145,000 | -- | |
| Williams Gregory W | $105,000 | Connor Title Co | |
| Kimberly A Morris | $97,000 | -- | |
| -- | $69,000 | -- |
Source: Public Records
Mortgage History
| Date | Status | Borrower | Loan Amount |
|---|---|---|---|
| Open | Szopa Amy L | $139,600 | |
| Previous Owner | Williams Gregory W | $95,000 | |
| Previous Owner | Kimberly A Morris | $95,297 |
Source: Public Records
Tax History Compared to Growth
Tax History
| Year | Tax Paid | Tax Assessment Tax Assessment Total Assessment is a certain percentage of the fair market value that is determined by local assessors to be the total taxable value of land and additions on the property. | Land | Improvement |
|---|---|---|---|---|
| 2024 | $6,109 | $136,120 | $38,500 | $97,620 |
| 2023 | $6,031 | $136,115 | $38,500 | $97,615 |
| 2022 | $4,731 | $91,210 | $31,360 | $59,850 |
| 2021 | $4,739 | $91,210 | $31,360 | $59,850 |
| 2020 | $4,745 | $91,210 | $31,360 | $59,850 |
| 2019 | $3,975 | $65,520 | $31,360 | $34,160 |
| 2018 | $3,914 | $65,520 | $31,360 | $34,160 |
| 2017 | $3,972 | $65,520 | $31,360 | $34,160 |
| 2016 | $4,255 | $64,230 | $19,360 | $44,870 |
| 2015 | $3,862 | $64,230 | $19,360 | $44,870 |
| 2014 | $3,872 | $64,230 | $19,360 | $44,870 |
| 2013 | $1,736 | $58,380 | $17,605 | $40,775 |
Source: Public Records
Map
Nearby Homes
- 420 Stanley Ave
- 472 E Whittier St
- 486 E Whittier St
- 432 E Kossuth St
- 490 Stanley Ave
- 497 E Kossuth St
- 480 Siebert St
- 479 Siebert St
- 547 E Whittier St
- 556 Stanley Ave
- 273 Reinhard Ave
- 781 Bruck St
- 320 E Columbus St
- 517 Forest St
- 243 E Whittier St Unit 245
- 575 E Columbus St Unit 577
- 418 Forest St
- 596 E Whittier St
- 1106-1116 Parsons Ave
- 520 Cline St
- 901 Beech St
- 905 Beech St Unit 907
- 905-907 Beech St
- 911 Beech St
- 895 Beech St
- 907 Beech St Unit 907
- 891 Beech St
- 898 Beech St
- 383 Schiller Alley
- 388 E Whittier St
- 887 Beech St
- 914 Beech St
- 396 E Whittier St
- 398 E Whittier St
- 400 E Whittier St
- 402 E Whittier St
- 390 E Whittier St
- 382 E Whittier St
- 885 Beech St
- 410 E Whittier St