
Seller's Agent in 2013
Jeff Theisen
RE/MAX
(715) 944-5372
19 Total Sales


Estimated Value: $460,000 - $560,000
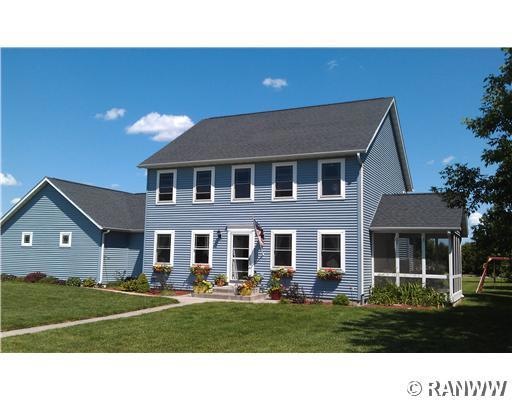
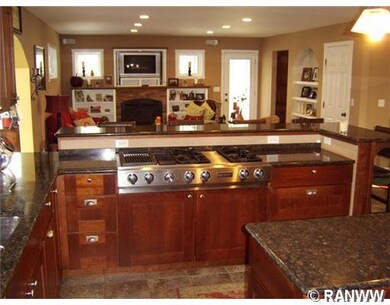
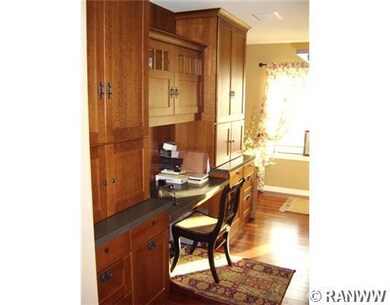
Kitchen features cherry cabinets, granite counter tops, stainless steel appliances, JennAir six burner gas cooktop, double oven and a large walk in pantry. Mud room between kitchen and garage with built in cubbies, abundance of ceramic tile and hardwood floors, six panel oak doors, screen porch off great room, sunroom (OTHER in rm detail) with access to 2 vinyl decks, in floor heat in lower level, in ground sprinkler, 4 car garage with walk up stairs to storage area above garage (10x41).
Last Agent to Sell the Property
RE/MAX Real Estate Group License #49629-90 Listed on: 01/16/2013
| Date | Buyer | Sale Price | Title Company |
|---|---|---|---|
| Herron James F | $260,000 | -- |
| Date | Event | Price | List to Sale | Price per Sq Ft |
|---|---|---|---|---|
| 11/20/2013 11/20/13 | Sold | $260,000 | -7.8% | $76 / Sq Ft |
| 10/21/2013 10/21/13 | Pending | -- | -- | -- |
| 01/16/2013 01/16/13 | For Sale | $282,000 | -- | $82 / Sq Ft |
| Year | Tax Paid | Tax Assessment Tax Assessment Total Assessment is a certain percentage of the fair market value that is determined by local assessors to be the total taxable value of land and additions on the property. | Land | Improvement |
|---|---|---|---|---|
| 2024 | $6,216 | $308,600 | $29,800 | $278,800 |
| 2023 | $5,709 | $308,600 | $29,800 | $278,800 |
| 2022 | $5,590 | $308,600 | $29,800 | $278,800 |
| 2021 | $5,244 | $308,600 | $29,800 | $278,800 |
| 2020 | $5,671 | $308,600 | $29,800 | $278,800 |
| 2019 | $6,169 | $263,900 | $27,300 | $236,600 |
| 2018 | $6,021 | $263,900 | $27,300 | $236,600 |
| 2017 | $5,490 | $263,900 | $27,300 | $236,600 |
| 2016 | $5,536 | $263,900 | $27,300 | $236,600 |
| 2015 | $5,544 | $263,900 | $27,300 | $236,600 |
| 2014 | $5,692 | $275,700 | $27,300 | $248,400 |
Seller's Agent in 2013
Jeff Theisen
RE/MAX
(715) 944-5372
19 Total Sales
Source: Northwestern Wisconsin Multiple Listing Service
MLS Number: 860935
APN: 22809-0123-66050001
Disclaimer: Certain information contained herein is derived from information provided by parties other than Homes.com. All information provided is deemed reliable, but is not guaranteed to be accurate and should be independently verified.
![]() IDX information is provided exclusively for personal, non-commercial use, and may not be used for any purpose other than to identify prospective properties consumers may be interested in purchasing. Information is deemed reliable but not guaranteed.
IDX information is provided exclusively for personal, non-commercial use, and may not be used for any purpose other than to identify prospective properties consumers may be interested in purchasing. Information is deemed reliable but not guaranteed.