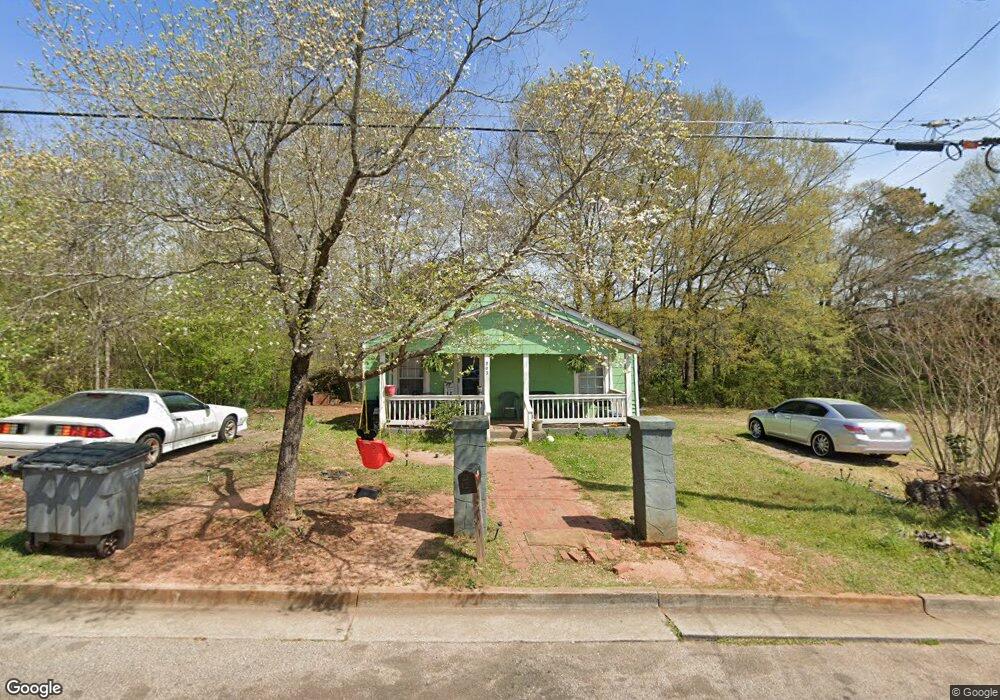
903 Buchanan St Lagrange, GA 30240
Estimated Value: $93,000 - $169,000
3
Beds
2
Baths
1,288
Sq Ft
$97/Sq Ft
Est. Value
About This Home
This home is located at 903 Buchanan St, Lagrange, GA 30240 and is currently estimated at $124,971, approximately $97 per square foot. 903 Buchanan St is a home located in Troup County with nearby schools including Ethel W. Kight Elementary School, Hollis Hand Elementary School, and Franklin Forest Elementary School.
Ownership History
Date
Name
Owned For
Owner Type
Purchase Details
Closed on
Aug 3, 2016
Sold by
Stribling Ty
Bought by
Stribling Beau Parker
Current Estimated Value
Purchase Details
Closed on
Mar 21, 2016
Sold by
David Bradley Rentals Llc
Bought by
Stribling Ty
Purchase Details
Closed on
Mar 12, 1996
Sold by
Morrow Bobby
Bought by
Perry David Bradley
Purchase Details
Closed on
Jan 27, 1986
Sold by
Harper Betty Joe Mitchell
Bought by
Morrow Bobby
Purchase Details
Closed on
Feb 19, 1985
Sold by
Harper Homer Felton
Bought by
Harper Betty Joe Mitchell
Purchase Details
Closed on
Apr 10, 1984
Sold by
Harper Homer F and Harper Betty J
Bought by
Harper Homer Felton
Purchase Details
Closed on
Mar 24, 1977
Sold by
Harper M A
Bought by
Harper Homer F and Harper Betty J
Purchase Details
Closed on
May 12, 1976
Sold by
Phipps Claudia H and Phipps Omar B
Bought by
Harper M A
Purchase Details
Closed on
Mar 12, 1975
Sold by
Harper M A
Bought by
Phipps Claudia H and Phipps Omar B
Purchase Details
Closed on
Oct 1, 1918
Bought by
Harper M A
Create a Home Valuation Report for This Property
The Home Valuation Report is an in-depth analysis detailing your home's value as well as a comparison with similar homes in the area
Purchase History
| Date | Buyer | Sale Price | Title Company |
|---|---|---|---|
| Stribling Beau Parker | $60,000 | -- | |
| Stribling Ty | $36,300 | -- | |
| Perry David Bradley | $40,000 | -- | |
| Morrow Bobby | $20,000 | -- | |
| Harper Betty Joe Mitchell | -- | -- | |
| Harper Homer Felton | -- | -- | |
| Harper Homer F | -- | -- | |
| Harper M A | -- | -- | |
| Phipps Claudia H | -- | -- | |
| Harper M A | -- | -- |
Source: Public Records
Tax History Compared to Growth
Tax History
| Year | Tax Paid | Tax Assessment Tax Assessment Total Assessment is a certain percentage of the fair market value that is determined by local assessors to be the total taxable value of land and additions on the property. | Land | Improvement |
|---|---|---|---|---|
| 2025 | $477 | $22,680 | $2,040 | $20,640 |
| 2024 | $477 | $17,480 | $2,040 | $15,440 |
| 2023 | $458 | $16,800 | $2,040 | $14,760 |
| 2022 | $447 | $16,000 | $2,040 | $13,960 |
| 2021 | $484 | $16,040 | $2,040 | $14,000 |
| 2020 | $484 | $16,040 | $2,040 | $14,000 |
| 2019 | $455 | $15,080 | $2,040 | $13,040 |
| 2018 | $455 | $15,080 | $2,040 | $13,040 |
| 2017 | $458 | $15,172 | $2,092 | $13,080 |
| 2016 | $453 | $15,022 | $2,092 | $12,930 |
| 2015 | $454 | $15,022 | $2,092 | $12,930 |
| 2014 | $434 | $14,341 | $2,092 | $12,249 |
| 2013 | -- | $15,228 | $2,092 | $13,136 |
Source: Public Records
Map
Nearby Homes
- 101 Crown St Unit LOT 5
- The Rhodes Plan at Crown Street Cottages
- The Truitt Plan at Crown Street Cottages
- The Callaway Plan at Crown Street Cottages
- 102 Crown St Unit LOT 1
- 802 Monroe St
- 205 Grady St
- 1518 Brownwood Ave
- 167 S Kight Dr
- 608 Wilburn Ave
- 610 Wilburn Ave
- 109 Garfield St
- 202 Parker Ln
- 133 Garfield St
- 612 S Lee St
- 107 Clark St
- 701 Jefferson St
- 211 Moores Hill
- 0 Moores Hill
- 507 S Lee St