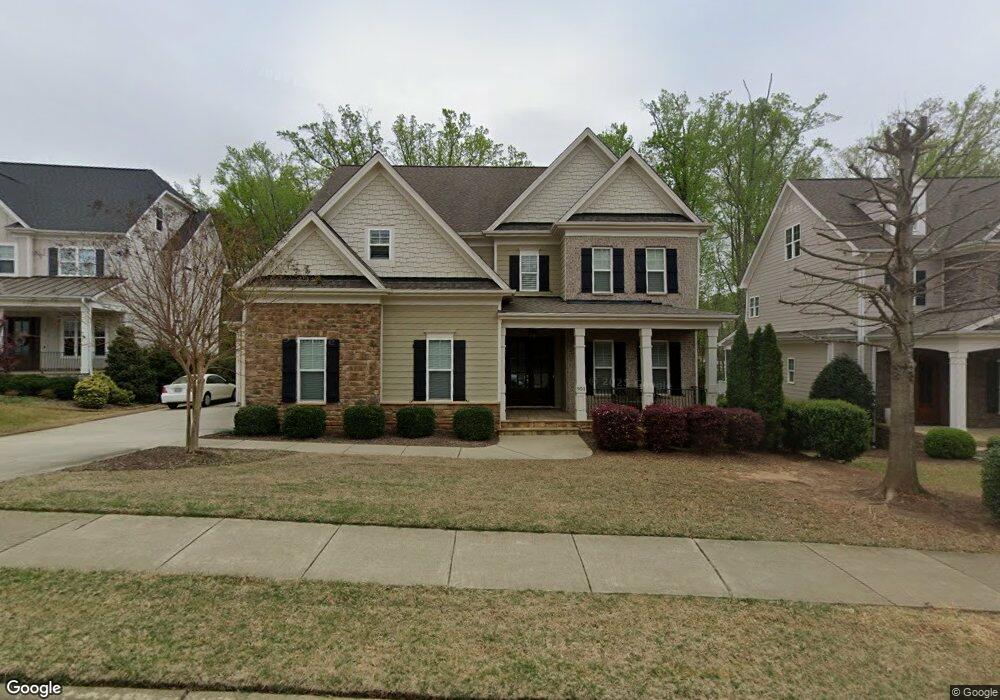
903 Cambridge Hall Loop Apex, NC 27539
Middle Creek NeighborhoodEstimated Value: $1,063,120 - $1,276,000
5
Beds
5
Baths
3,991
Sq Ft
$292/Sq Ft
Est. Value
About This Home
This home is located at 903 Cambridge Hall Loop, Apex, NC 27539 and is currently estimated at $1,167,280, approximately $292 per square foot. 903 Cambridge Hall Loop is a home located in Wake County with nearby schools including Yates Mill Elementary School, Dillard Drive Magnet Middle School, and Middle Creek High.
Ownership History
Date
Name
Owned For
Owner Type
Purchase Details
Closed on
Sep 26, 2014
Bought by
Chiu Evan and Chiu Lisa
Current Estimated Value
Purchase Details
Closed on
Sep 27, 2012
Sold by
S & K Partnership Llc
Bought by
Wardson Construction Inc
Home Financials for this Owner
Home Financials are based on the most recent Mortgage that was taken out on this home.
Original Mortgage
$82,500
Interest Rate
3.68%
Mortgage Type
Future Advance Clause Open End Mortgage
Purchase Details
Closed on
Jun 2, 2011
Sold by
Robuck Homes Triangle Llc
Bought by
S & K Partnership L L C
Purchase Details
Closed on
Jun 4, 2010
Sold by
Regions Bank
Bought by
Robuck Homes Triangle Llc
Purchase Details
Closed on
Dec 29, 2009
Sold by
Cattano Construction Inc
Bought by
Regions Bank
Create a Home Valuation Report for This Property
The Home Valuation Report is an in-depth analysis detailing your home's value as well as a comparison with similar homes in the area
Home Values in the Area
Average Home Value in this Area
Purchase History
| Date | Buyer | Sale Price | Title Company |
|---|---|---|---|
| Chiu Evan | $622,000 | -- | |
| Wardson Construction Inc | $130,000 | None Available | |
| S & K Partnership L L C | $75,000 | None Available | |
| Robuck Homes Triangle Llc | $500,000 | None Available | |
| Regions Bank | $1,145,822 | None Available |
Source: Public Records
Mortgage History
| Date | Status | Borrower | Loan Amount |
|---|---|---|---|
| Previous Owner | Wardson Construction Inc | $82,500 |
Source: Public Records
Tax History
| Year | Tax Paid | Tax Assessment Tax Assessment Total Assessment is a certain percentage of the fair market value that is determined by local assessors to be the total taxable value of land and additions on the property. | Land | Improvement |
|---|---|---|---|---|
| 2025 | $8,816 | $1,026,208 | $250,000 | $776,208 |
| 2024 | $8,625 | $1,026,208 | $250,000 | $776,208 |
Source: Public Records
Map
Nearby Homes
- 6509 Ten-Ten Rd
- 1449 Commons Ford Place
- 5005 Cedar Glen Ct
- 2117 Bee Cave Ct
- 3505 Creekwood Bluffs Ct
- 3901 Bamburgh Ln
- 1305 Commons Ford Place
- 3116 Summer Oaks Dr
- 4013 Saint Edmunds Ln
- 4116 Cary Oaks Dr
- 8613 Lawdraker Rd
- 116 Vintage Hill Cir
- 1108 Bradshaw Ct
- 3609 Knollcreek Dr
- 717 Churton Place
- 4304 Triland Way
- 4425 Surry Ridge Cir
- 3628 Jamison Park Dr
- 8609 Cavatina Ct
- 102 Hemingford Grey Ct
- 903 Cambridge Hall Loop Unit 16
- 901 Cambridge Hall Loop
- 905 Cambridge Hall Loop
- 907 Cambridge Hall Loop
- 811 Cambridge Hall Loop Unit L14
- 811 Cambridge Hall Loop
- 510 Westbury Hill Ln
- 906 Cambridge Hall Loop
- 909 Cambridge Hall Loop
- 508 Westbury Hill Ln
- 810 Cambridge Hall Loop
- 809 Cambridge Hall Loop Unit L13
- 809 Cambridge Hall Loop
- 910 Cambridge Hall Loop
- 911 Cambridge Hall Loop
- 808 Cambridge Hall Loop
- 506 Westbury Hill Ln
- 506 Westbury Hill Ln
- 807 Cambridge Hall Loop
- 509 Westbury Hill Ln
Your Personal Tour Guide
Ask me questions while you tour the home.