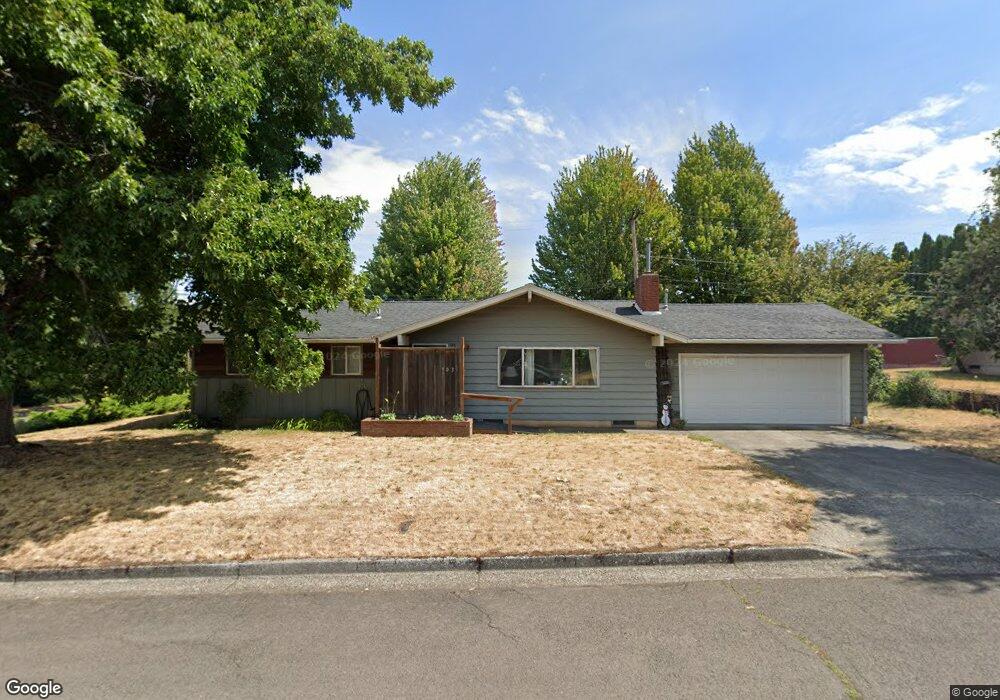
903 Cherry Ct Hood River, OR 97031
Estimated Value: $596,576 - $635,000
3
Beds
2
Baths
1,428
Sq Ft
$431/Sq Ft
Est. Value
About This Home
This home is located at 903 Cherry Ct, Hood River, OR 97031 and is currently estimated at $615,788, approximately $431 per square foot. 903 Cherry Ct is a home located in Hood River County with nearby schools including May Street Elementary School, Hood River Middle School, and Hood River Valley High School.
Ownership History
Date
Name
Owned For
Owner Type
Purchase Details
Closed on
Nov 23, 2015
Sold by
Jorck Harald and Jorck Connie
Bought by
Warrenka David W and Warrenka Marian D
Current Estimated Value
Purchase Details
Closed on
Sep 25, 2006
Sold by
Ritchie G Scott and Griffin Katherine V
Bought by
Jorck Harald and Jorck Connie
Home Financials for this Owner
Home Financials are based on the most recent Mortgage that was taken out on this home.
Original Mortgage
$239,200
Interest Rate
6.43%
Mortgage Type
New Conventional
Purchase Details
Closed on
Jun 6, 2005
Sold by
Conger Jon C and Conger Maurice V
Bought by
Ritchie G Scott and Griffin Katherine
Home Financials for this Owner
Home Financials are based on the most recent Mortgage that was taken out on this home.
Original Mortgage
$45,700
Interest Rate
5.74%
Mortgage Type
Purchase Money Mortgage
Create a Home Valuation Report for This Property
The Home Valuation Report is an in-depth analysis detailing your home's value as well as a comparison with similar homes in the area
Purchase History
| Date | Buyer | Sale Price | Title Company |
|---|---|---|---|
| Warrenka David W | $292,000 | Amerititle | |
| Jorck Harald | $299,000 | Amerititle | |
| Ritchie G Scott | $228,700 | Amerititle |
Source: Public Records
Mortgage History
| Date | Status | Borrower | Loan Amount |
|---|---|---|---|
| Previous Owner | Jorck Harald | $239,200 | |
| Previous Owner | Ritchie G Scott | $45,700 |
Source: Public Records
Tax History
| Year | Tax Paid | Tax Assessment Tax Assessment Total Assessment is a certain percentage of the fair market value that is determined by local assessors to be the total taxable value of land and additions on the property. | Land | Improvement |
|---|---|---|---|---|
| 2025 | $3,029 | $229,360 | $155,670 | $73,690 |
| 2024 | $2,950 | $222,680 | $151,140 | $71,540 |
| 2023 | $2,950 | $216,200 | $146,740 | $69,460 |
| 2022 | $2,726 | $209,910 | $57,870 | $152,040 |
| 2021 | $2,739 | $203,800 | $56,180 | $147,620 |
| 2020 | $2,648 | $197,870 | $54,550 | $143,320 |
| 2019 | $2,470 | $192,110 | $52,960 | $139,150 |
| 2018 | $2,496 | $186,520 | $51,410 | $135,110 |
| 2017 | $2,767 | $181,090 | $49,910 | $131,180 |
| 2016 | $2,697 | $175,820 | $48,450 | $127,370 |
| 2015 | $2,649 | $170,700 | $47,040 | $123,660 |
| 2014 | $2,609 | $165,730 | $45,670 | $120,060 |
| 2013 | -- | $160,910 | $44,340 | $116,570 |
Source: Public Records
Map
Nearby Homes
- 2860 May St
- 2019 Montello Ave
- 2419 Prospect Ave
- 1826 Armadale Ave
- 2455 Belmont Dr
- 3653 Park Place
- 921 Goose Way
- 1807 Columbia St
- 1749 22nd St
- 814 Henderson Rd
- 419421 Maxs Place
- 913 Falcon Ct
- 1250 29th St
- 1510 Lincoln St
- 1110 Red Tail Loop
- 1534 Lincoln St
- 2727 Cascade Ave
- 1222 Lincoln St
- 811 Oak St
- 1102 Rock Creek Rd
Your Personal Tour Guide
Ask me questions while you tour the home.