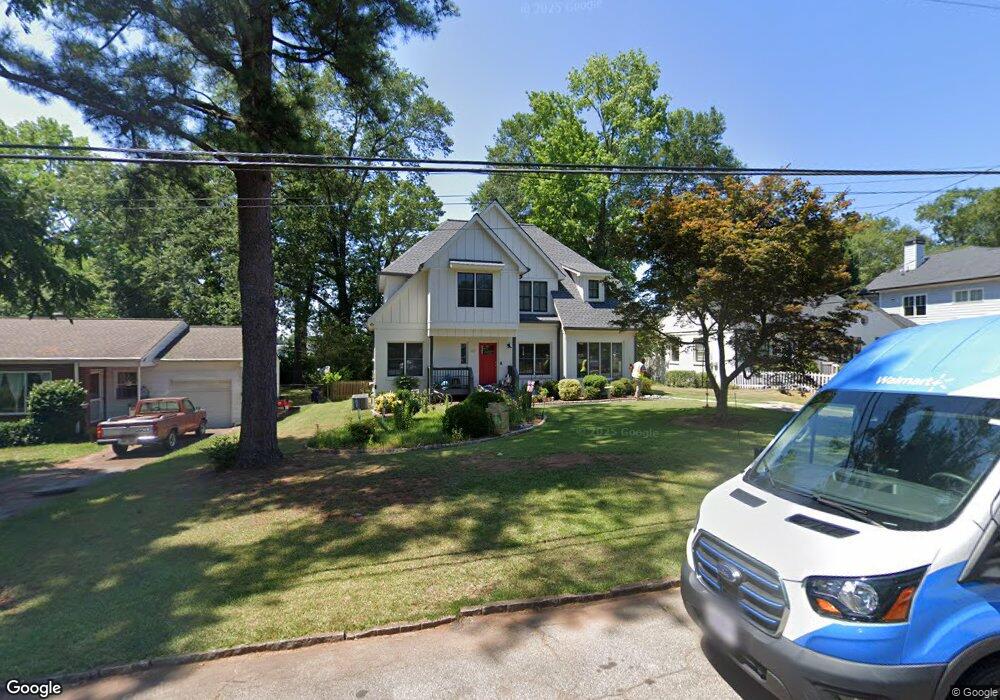
903 Derrydown Way Decatur, GA 30030
Winnona Park Historic District NeighborhoodEstimated Value: $683,000 - $877,000
4
Beds
3
Baths
2,400
Sq Ft
$339/Sq Ft
Est. Value
About This Home
This home is located at 903 Derrydown Way, Decatur, GA 30030 and is currently estimated at $813,671, approximately $339 per square foot. 903 Derrydown Way is a home located in DeKalb County with nearby schools including Winnona Park Elementary School, Talley Street Elementary School, and Beacon Hill Middle School.
Ownership History
Date
Name
Owned For
Owner Type
Purchase Details
Closed on
Mar 12, 2012
Sold by
Penney Shelly L
Bought by
Penney Shelly L and Penney James C
Current Estimated Value
Home Financials for this Owner
Home Financials are based on the most recent Mortgage that was taken out on this home.
Original Mortgage
$186,500
Outstanding Balance
$127,772
Interest Rate
3.89%
Mortgage Type
New Conventional
Estimated Equity
$685,899
Purchase Details
Closed on
Nov 3, 2006
Sold by
Elias Kathryn L
Bought by
Penney Shelly L
Home Financials for this Owner
Home Financials are based on the most recent Mortgage that was taken out on this home.
Original Mortgage
$194,400
Interest Rate
6.27%
Mortgage Type
New Conventional
Purchase Details
Closed on
Nov 30, 2000
Sold by
Hanson Alberta A
Bought by
Elias Kathryn L
Home Financials for this Owner
Home Financials are based on the most recent Mortgage that was taken out on this home.
Original Mortgage
$127,920
Interest Rate
7.71%
Mortgage Type
New Conventional
Create a Home Valuation Report for This Property
The Home Valuation Report is an in-depth analysis detailing your home's value as well as a comparison with similar homes in the area
Home Values in the Area
Average Home Value in this Area
Purchase History
| Date | Buyer | Sale Price | Title Company |
|---|---|---|---|
| Penney Shelly L | -- | -- | |
| Penney Shelly L | $243,000 | -- | |
| Elias Kathryn L | $159,900 | -- |
Source: Public Records
Mortgage History
| Date | Status | Borrower | Loan Amount |
|---|---|---|---|
| Open | Penney Shelly L | $186,500 | |
| Previous Owner | Penney Shelly L | $194,400 | |
| Previous Owner | Elias Kathryn L | $127,920 |
Source: Public Records
Tax History Compared to Growth
Tax History
| Year | Tax Paid | Tax Assessment Tax Assessment Total Assessment is a certain percentage of the fair market value that is determined by local assessors to be the total taxable value of land and additions on the property. | Land | Improvement |
|---|---|---|---|---|
| 2025 | $100 | $347,960 | $98,120 | $249,840 |
| 2024 | $171 | $340,200 | $98,120 | $242,080 |
| 2023 | $171 | $333,080 | $98,120 | $234,960 |
| 2022 | $12,947 | $299,400 | $96,400 | $203,000 |
| 2021 | $14,382 | $269,880 | $34,080 | $235,800 |
| 2020 | $8,555 | $218,320 | $34,080 | $184,240 |
| 2019 | $7,902 | $174,040 | $42,520 | $131,520 |
| 2018 | $4,596 | $152,640 | $37,160 | $115,480 |
| 2017 | $5,011 | $104,960 | $26,240 | $78,720 |
| 2016 | $2,488 | $133,160 | $34,080 | $99,080 |
| 2014 | $2,829 | $88,080 | $19,520 | $68,560 |
Source: Public Records
Map
Nearby Homes
- 2630 Talley St Unit 326
- 2630 Talley St Unit 3
- 2630 Talley St Unit 106
- 2630 Talley St Unit 321
- 2516 Talley St
- 1 Village Walk Dr
- 345 Shadowmoor Dr
- 417 E College Ave Unit 302
- 223 Avery St
- 915 Katie Kerr Dr
- 221 Mountain View St
- 820 S Columbia Dr
- 1112 Ashbury Dr
- Castellaro 62, fosso
- 1164 Oldfield Rd
- 119 N Candler St
- 136 Bucher Dr
- 1152 Conway Rd
- 510 E Ponce de Leon Ave Unit J
- 1044 N Carter Rd
- 907 Derrydown Way
- 895 Derrydown Way
- 913 Derrydown Way
- 891 Derrydown Way
- 885 Derrydown Way
- 902 Derrydown Way
- 902 Derrydown Way Unit 7
- 906 Derrydown Way
- 923 Derrydown Way
- 881 Derrydown Way
- 225 New St Unit 21
- 894 Derrydown Way
- 912 Derrydown Way
- 890 Derrydown Way
- 916 Derrydown Way
- 927 Derrydown Way
- 875 Derrydown Way
- 922 Derrydown Way
- 336 S Columbia Dr
- 880 Derrydown Way