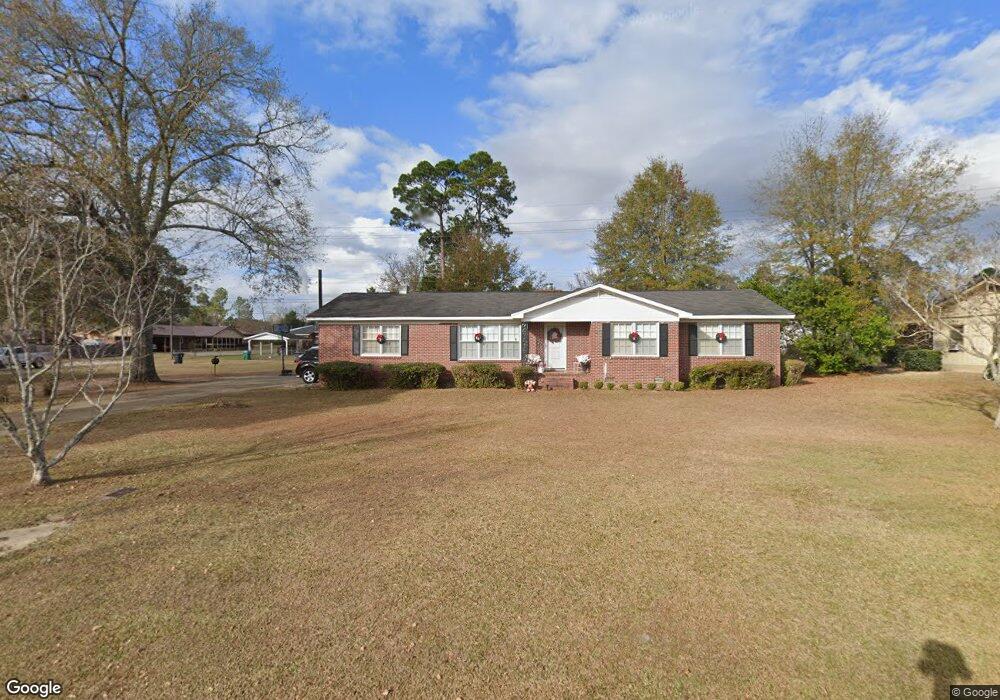
903 E 28th Ave Cordele, GA 31015
Estimated Value: $161,000 - $177,000
3
Beds
2
Baths
1,401
Sq Ft
$119/Sq Ft
Est. Value
About This Home
This home is located at 903 E 28th Ave, Cordele, GA 31015 and is currently estimated at $166,617, approximately $118 per square foot. 903 E 28th Ave is a home located in Crisp County with nearby schools including Crisp County Elementary School, Crisp County Primary School, and Crisp County Middle School.
Ownership History
Date
Name
Owned For
Owner Type
Purchase Details
Closed on
Apr 30, 2004
Sold by
Mcmichael Zera Lee
Bought by
Haugabrook Vanessa and Haugabrook Kenneth H
Current Estimated Value
Purchase Details
Closed on
Mar 2, 2000
Sold by
Mcmichael Obie and Mcmichael Lee
Bought by
Mcmichael Zera Lee
Purchase Details
Closed on
Feb 21, 1984
Sold by
Frix Roy H
Bought by
Mcmichael Obie and Mcmichael Lee
Purchase Details
Closed on
Oct 1, 1979
Bought by
Frix Roy H
Create a Home Valuation Report for This Property
The Home Valuation Report is an in-depth analysis detailing your home's value as well as a comparison with similar homes in the area
Purchase History
| Date | Buyer | Sale Price | Title Company |
|---|---|---|---|
| Haugabrook Vanessa | -- | -- | |
| Mcmichael Zera Lee | -- | -- | |
| Mcmichael Obie | $58,500 | -- | |
| Frix Roy H | $50,000 | -- |
Source: Public Records
Tax History
| Year | Tax Paid | Tax Assessment Tax Assessment Total Assessment is a certain percentage of the fair market value that is determined by local assessors to be the total taxable value of land and additions on the property. | Land | Improvement |
|---|---|---|---|---|
| 2025 | $1,647 | $49,308 | $4,866 | $44,442 |
| 2024 | $1,568 | $45,148 | $4,866 | $40,282 |
| 2023 | $1,471 | $40,651 | $2,433 | $38,218 |
| 2022 | $967 | $38,572 | $2,433 | $36,139 |
| 2021 | $947 | $36,491 | $2,433 | $34,058 |
| 2020 | $971 | $36,491 | $2,433 | $34,058 |
| 2019 | $978 | $36,491 | $2,433 | $34,058 |
| 2018 | $829 | $30,111 | $3,893 | $26,218 |
| 2017 | $1,223 | $30,111 | $3,893 | $26,218 |
| 2016 | $831 | $30,111 | $3,893 | $26,218 |
| 2015 | -- | $30,112 | $3,893 | $26,218 |
| 2014 | -- | $30,112 | $3,893 | $26,218 |
| 2013 | -- | $30,111 | $3,893 | $26,218 |
Source: Public Records
Map
Nearby Homes
- 1018 E 28th Ave
- 615 E 28th Ave
- 618 E 27th Ave
- 614 E 26th Ave
- E 8th Ave
- 120 Edgewood Dr
- 1206 Fleming Rd
- 912 Rose Ln
- 412 E 30th Ave
- 1002 Camellia Dr
- 720 E 20th Ave
- 1410 E 24th Ave
- 1304 Robin St
- 1506 E 24th Ave
- 1603 Pine Acres Dr
- 716 E 18th Ave
- 714 E 18th Ave
- 1001 Stewart Ave
- 709 Fleming Rd
- 1509 E 20th Ave
Your Personal Tour Guide
Ask me questions while you tour the home.