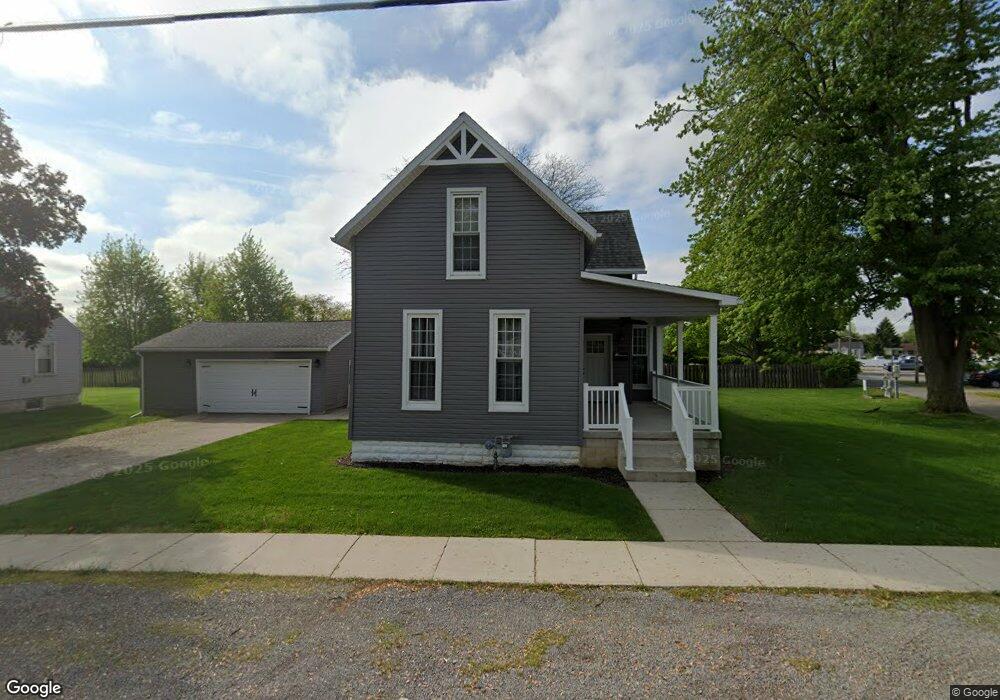
903 E 2nd St Delphos, OH 45833
Estimated Value: $149,000 - $182,000
3
Beds
1
Bath
1,539
Sq Ft
$107/Sq Ft
Est. Value
About This Home
This home is located at 903 E 2nd St, Delphos, OH 45833 and is currently estimated at $164,990, approximately $107 per square foot. 903 E 2nd St is a home located in Allen County with nearby schools including Delphos St. John's Elementary School and Delphos St. John's High School.
Ownership History
Date
Name
Owned For
Owner Type
Purchase Details
Closed on
Jul 27, 2018
Bought by
Richards Family Property
Current Estimated Value
Purchase Details
Closed on
Aug 26, 2015
Sold by
Vonderwell Susan M and Vonderwell David
Bought by
Richards Ronad D
Purchase Details
Closed on
Jan 18, 2006
Sold by
Betz Larry E and Betz Laura J
Bought by
Sovereign Bank
Purchase Details
Closed on
Apr 27, 1999
Sold by
Hiller Mary
Bought by
Betz Larry and Betz Laura
Home Financials for this Owner
Home Financials are based on the most recent Mortgage that was taken out on this home.
Original Mortgage
$41,834
Interest Rate
7.17%
Mortgage Type
New Conventional
Purchase Details
Closed on
Oct 1, 1971
Bought by
Hiller Mary Louise
Create a Home Valuation Report for This Property
The Home Valuation Report is an in-depth analysis detailing your home's value as well as a comparison with similar homes in the area
Home Values in the Area
Average Home Value in this Area
Purchase History
| Date | Buyer | Sale Price | Title Company |
|---|---|---|---|
| Richards Family Property | -- | -- | |
| Richards Ronad D | $49,000 | None Available | |
| Sovereign Bank | $49,000 | None Available | |
| Betz Larry | $49,000 | -- | |
| Hiller Mary Louise | $6,000 | -- |
Source: Public Records
Mortgage History
| Date | Status | Borrower | Loan Amount |
|---|---|---|---|
| Previous Owner | Betz Larry | $41,834 |
Source: Public Records
Tax History
| Year | Tax Paid | Tax Assessment Tax Assessment Total Assessment is a certain percentage of the fair market value that is determined by local assessors to be the total taxable value of land and additions on the property. | Land | Improvement |
|---|---|---|---|---|
| 2024 | $1,486 | $46,840 | $10,050 | $36,790 |
| 2023 | $1,171 | $34,930 | $7,490 | $27,440 |
| 2022 | $1,199 | $34,930 | $7,490 | $27,440 |
| 2021 | $1,207 | $34,930 | $7,490 | $27,440 |
| 2020 | $1,025 | $31,160 | $7,180 | $23,980 |
| 2019 | $1,025 | $31,160 | $7,180 | $23,980 |
| 2018 | $1,012 | $31,160 | $7,180 | $23,980 |
| 2017 | $970 | $28,990 | $7,180 | $21,810 |
| 2016 | $869 | $25,520 | $7,180 | $18,340 |
| 2015 | $815 | $25,520 | $7,180 | $18,340 |
| 2014 | $815 | $23,980 | $6,900 | $17,080 |
| 2013 | $820 | $23,980 | $6,900 | $17,080 |
Source: Public Records
Map
Nearby Homes
- 821 E 3rd St
- 404 E 3rd St
- 628 N Pierce St
- 201 E 5th St
- 610 N Washington St
- 221 S Main St
- 702 N Main St
- 483 S Franklin St
- 424 S Canal St
- 1000 Colettas Way
- 827 S Washington St
- 709 W 4th St
- 415 Maple St
- 537 / 539 Toomey
- 6800 N Defiance Trail
- 8448 Elida Rd
- 3755 Grubb Rd N
- 180 3rd St
- 608 N Adams St
- 9750 Middle Point Rd
Your Personal Tour Guide
Ask me questions while you tour the home.