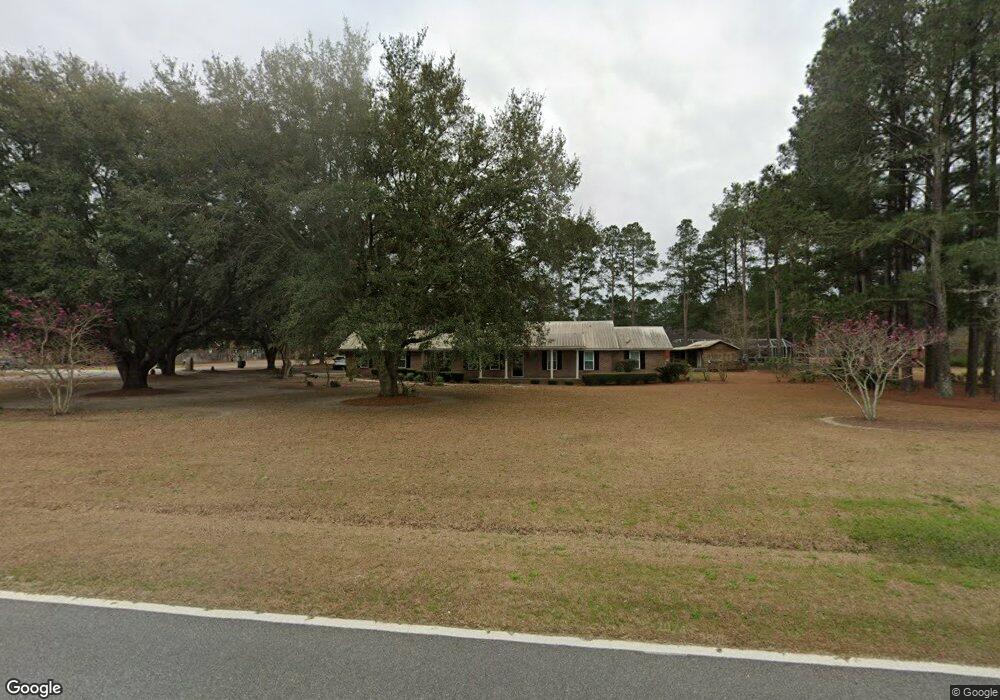
903 E Hencart Rd Unit E Glennville, GA 30427
Estimated Value: $245,899 - $375,000
--
Bed
2
Baths
1,665
Sq Ft
$188/Sq Ft
Est. Value
About This Home
This home is located at 903 E Hencart Rd Unit E, Glennville, GA 30427 and is currently estimated at $313,475, approximately $188 per square foot. 903 E Hencart Rd Unit E is a home located in Tattnall County with nearby schools including Tattnall County High School and Glennville Christian Academy.
Ownership History
Date
Name
Owned For
Owner Type
Purchase Details
Closed on
Dec 11, 2014
Sold by
Cowart James Ernest
Bought by
Foster Charles Crisp and Foster Mollie Durrence
Current Estimated Value
Home Financials for this Owner
Home Financials are based on the most recent Mortgage that was taken out on this home.
Original Mortgage
$120,000
Outstanding Balance
$41,703
Interest Rate
4.07%
Mortgage Type
New Conventional
Estimated Equity
$271,772
Purchase Details
Closed on
Aug 8, 2005
Sold by
Jasinski Mathew S
Bought by
Cowart James Ernest and Cowart Tammy D
Home Financials for this Owner
Home Financials are based on the most recent Mortgage that was taken out on this home.
Original Mortgage
$35,000
Interest Rate
5.57%
Mortgage Type
New Conventional
Purchase Details
Closed on
Jan 4, 2001
Sold by
Jasinski Mathew S
Bought by
Jasinski Mathew B
Purchase Details
Closed on
Nov 1, 1995
Bought by
Jasinski Mathew S
Create a Home Valuation Report for This Property
The Home Valuation Report is an in-depth analysis detailing your home's value as well as a comparison with similar homes in the area
Home Values in the Area
Average Home Value in this Area
Purchase History
| Date | Buyer | Sale Price | Title Company |
|---|---|---|---|
| Foster Charles Crisp | $150,000 | -- | |
| Cowart James Ernest | $132,500 | -- | |
| Jasinski Mathew S | -- | -- | |
| Jasinski Mathew B | -- | -- | |
| Jasinski Mathew S | $6,500 | -- |
Source: Public Records
Mortgage History
| Date | Status | Borrower | Loan Amount |
|---|---|---|---|
| Open | Foster Charles Crisp | $120,000 | |
| Previous Owner | Cowart James Ernest | $35,000 |
Source: Public Records
Tax History Compared to Growth
Tax History
| Year | Tax Paid | Tax Assessment Tax Assessment Total Assessment is a certain percentage of the fair market value that is determined by local assessors to be the total taxable value of land and additions on the property. | Land | Improvement |
|---|---|---|---|---|
| 2024 | $3,154 | $90,164 | $14,920 | $75,244 |
| 2023 | $2,513 | $90,164 | $14,920 | $75,244 |
| 2022 | $2,675 | $76,724 | $14,920 | $61,804 |
| 2021 | $2,443 | $71,796 | $14,920 | $56,876 |
| 2020 | $2,444 | $71,796 | $14,920 | $56,876 |
| 2019 | $2,111 | $60,716 | $9,560 | $51,156 |
| 2018 | $2,141 | $60,716 | $9,560 | $51,156 |
| 2017 | $1,358 | $50,996 | $9,560 | $41,436 |
| 2016 | $411 | $51,556 | $9,560 | $41,996 |
| 2015 | -- | $52,076 | $9,560 | $42,516 |
| 2014 | -- | $54,716 | $9,560 | $45,156 |
| 2013 | -- | $54,716 | $9,560 | $45,156 |
Source: Public Records
Map
Nearby Homes